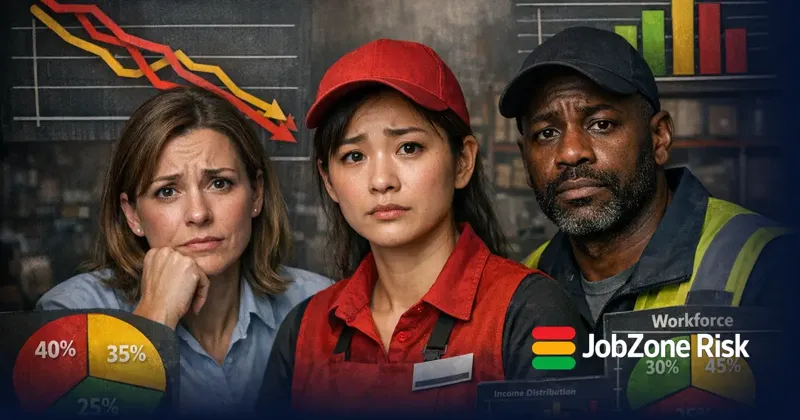
Impact of AI on Employment [June 2026]
The impact of AI on employment is not one story — it is three running simultaneously. AI is displacing some roles, creating entirely new ones, and transforming the majority of what remains. We scored 3649 roles against actual AI capabilities and mapped them to BLS data covering 🇺🇸 170.5M US workers. Then we compiled 113+ externally-sourced statistics from the IMF, WEF, Goldman Sachs, McKinsey, Harvard, Stanford, and more.
The result: 🇺🇸 44.3M US workers sit in RED zone roles where AI can already perform the majority of core tasks. 🇺🇸 56.2M US workers are in structurally protected GREEN zone roles. And 🇺🇸 68.1M US workers — the largest group — are in YELLOW zone roles where AI changes the work without eliminating the worker. Below, we break down each dimension of AI’s impact and what it means for your career.
📊 The Full Picture — Displacement + Creation + Augmentation
AI is not doing one thing to the workforce. It is doing three things simultaneously: displacing some roles, creating new ones, and transforming the majority. Understanding the ratio between these three forces is the starting point for any career decision.
We scored each role across five dimensions — resistance, evidence, barriers, protective principles, and AI growth correlation — using the AIJRI methodology. The average score across all 3649 roles is 45.1 out of 100.
| Finding | Value | Source |
|---|---|---|
| Roles displaced globally by 2030 (WEF) | 92 million | World Economic Forum (2025) |
| New roles created globally by 2030 (WEF) | 170 million | World Economic Forum (2025) |
| Net global job gain 2025–2030 (WEF) | +78 million | WEF Future of Jobs Report 2025 |
| Jobs exposed to AI globally (Goldman Sachs) | 300 million | Goldman Sachs |
| Global jobs exposed to AI (IMF) | 40% | International Monetary Fund (2024) |
| OECD: occupations with 50%+ of tasks automatable | 27% | OECD Employment Outlook 2023 |
| US employment at high displacement risk (SHRM) | 6% | SHRM Automation Survey (20,262 workers, 2025) |
| US labor income automatable by generative AI (Wharton) | 40% | Wharton Penn Budget Model (Sep 2025) |
The range of forecasts is staggering — from the WEF’s net gain of 78 million jobs to Goldman Sachs’ 300 million “exposed.” Why do the numbers diverge? Three factors: scope (global vs. US vs. OECD), methodology (task-based vs. occupation-based), and the critical distinction between “exposed” and “displaced.” A job can be exposed to AI without being eliminated — many are transformed instead.
The Three Outcomes
Our data maps every assessed role to one of three outcomes. 516 roles (26% of mapped workers) score below 33 — AI can perform the majority of core tasks, and headcount will shrink. 1364 roles (40% of workers) score 33–47 — AI transforms the work but employment survives. 1769 roles (33% of workers) score 48+ — structurally protected by physical presence, licensing, or trust. The workforce leans toward protection: the average score is 45.1/100.
The domain breakdown shows where AI exposure concentrates. Sectors with lower average scores have more roles where AI can already perform core tasks.
| Domain | Avg JobZone Score |
|---|---|
| Trades & Physical | 60.5 |
| Veterinary & Animal Care | 59.8 |
| Military | 57.6 |
| Healthcare | 57.5 |
| Sports & Recreation | 56.2 |
| AI | 56.0 |
| Social Services | 55.8 |
| Religious & Community | 54.4 |
| Public Safety | 53.0 |
| Utilities & Energy | 50.6 |
| Other | 50.5 |
| Education | 49.1 |
| Cybersecurity | 49.0 |
| Agriculture | 48.1 |
| Transportation | 46.4 |
| Engineering | 46.0 |
| Government & Public Admin | 42.4 |
| Retail & Service | 40.8 |
| Science & Research | 40.7 |
| Legal & Compliance | 39.7 |
| Library, Museum & Archives | 39.4 |
| Creative & Media | 37.2 |
| Development | 36.0 |
| Cloud & Infrastructure | 35.1 |
| Real Estate & Property | 34.5 |
| Manufacturing | 31.1 |
| Business & Operations | 29.6 |
| Data | 28.6 |
🔴 Jobs Being Displaced
Displacement is the headline that gets the clicks. But the data shows a more specific pattern: AI targets roles that are digital-first, pattern-based, and unregulated. Physical, licensed, and trust-dependent work remains structurally protected.
| Finding | Value | Source |
|---|---|---|
| AI-attributed US job losses in 2025 | 55,000 | Challenger, Gray & Christmas |
| Cumulative AI-attributed layoffs since 2023 (US) | 71,825 | Challenger, Gray & Christmas |
| AI layoffs that are anticipatory, not performance-based (Global) | 77% | HBR (Jan 2026) |
| Companies that have replaced workers with AI (US) | 30% | Resume.org (1,000 US leaders) |
| Firms planning to replace workers with AI (Global, WEF) | 37% | WEF |
| Companies hiring fewer due to AI (2026, Global) | 29% | HBR (Jan 2026) |
| Employers expecting AI workforce reductions (Global) | 1 in 6 | Industry surveys |
| Executives who regret AI-driven workforce cuts (Global, Forrester) | 55% | Forrester Predictions 2026 |
| Freelance writing jobs dropped post-ChatGPT (US) | -30% | Harvard / Imperial College London (2024) |
| Freelance software development gigs dropped (US) | -21% | Harvard / Imperial College London (2024) |
| Freelance graphic design work dropped (US) | -17% | Harvard / Imperial College London (2024) |
| Klarna AI chatbot: 75% of customer service (Global) | 75% (2.3M conversations/month) | Klarna (2024) |
| BT: 10,000 jobs replaced by AI (UK) | 55,000 total / 10,000 AI-replaced | BT Group (2023) |
The gap between forecasts (300 million “exposed”) and measured losses (71,825 cumulative AI-attributed layoffs) is roughly 4,000x. This does not mean the forecasts are wrong — it means “exposed” and “eliminated” measure different things. Displacement happens through gradual task automation and headcount attrition, not overnight mass layoffs.
⚠️ Key Finding: Most AI Layoffs Are Anticipatory
Harvard Business Review found that 77% of AI-attributed layoffs are anticipatory — companies cutting roles in preparation for AI, not in response to proven AI performance. Only 2% of organisations have made large-scale AI-driven reductions. And Forrester reports that executives who made early AI-driven workforce cuts regret the decision. The real AI displacement number is smaller than the headlines — but growing.
20 Roles Facing the Most Displacement
| # | Role | Score |
|---|---|---|
| 1 | File Clerks (Mid-Level) | 1.5 /100 |
| 2 | Micro-Task Worker (Online) (Mid-Level) | 1.7 /100 |
| 3 | Data Entry Keyer (Mid-Level) | 2.3 /100 |
| 4 | Word Processor and Typist (Mid-Level) | 2.6 /100 |
| 5 | Vulnerability Tester / Scanner Operator (Entry-Level) | 2.7 /100 |
| 6 | Telephone Operator (Mid-Level) | 3.0 /100 |
| 7 | Virtual Assistant (Entry-to-Mid Level) | 3.2 /100 |
| 8 | Live Chat Support Agent (Entry-to-Mid Level) | 3.4 /100 |
| 9 | Telemarketer (Mid-Level) | 3.4 /100 |
| 10 | Medical Transcriptionist (Mid-Level) | 3.6 /100 |
| 11 | Toll Collector (Mid-Level) | 3.6 /100 |
| 12 | Machine Feeders and Offbearers (Mid-Level) | 3.6 /100 |
| 13 | Procurement Clerks (Mid-Level) | 3.6 /100 |
| 14 | Correspondence Clerk (Mid-Level) | 3.6 /100 |
| 15 | Desktop Publisher (Mid-Level) | 3.7 /100 |
| 16 | Office Machine Operator, Except Computer (Mid-Level) | 3.9 /100 |
| 17 | OnlyFans Chatter / Ghostwriter (Entry-to-Mid Level) | 4.0 /100 |
| 18 | Meter Reader (Mid-Level) | 4.1 /100 |
| 19 | Medical Scribe (Mid-Level) | 4.3 /100 |
| 20 | Insurance Claims and Policy Processing Clerk (Entry-to-Mid) | 4.4 /100 |
These 20 roles share a common profile: digital-first, pattern-based, unregulated, and no physical presence required. Being on this list does not mean the role disappears overnight — it means AI can already do most of the work, and headcount will shrink as employers adopt. The freelance data shows what happens first: writing jobs dropped 30%, software gigs dropped 21%, and design dropped 17% post-ChatGPT.
Displacement Traits
- • Digital-only workflow: all core tasks happen on a screen
- • Pattern-based outputs: repeatable templates, rules, or formats
- • No licensing requirement: no regulatory barrier to AI substitution
- • Low trust threshold: clients accept automated output
- • Measurable quality: output can be benchmarked objectively
Protection Traits
- • Physical presence required: work happens at a location or on a body
- • Licensing or certification: regulatory barriers prevent AI substitution
- • High-stakes trust: clients demand a human
- • Unpredictable environments: each situation is novel
- • Liability exposure: someone must be legally accountable
Full analysis: Jobs Most at Risk from AI · AI and Job Loss Statistics
🟢 Jobs Being Created
AI is not just eliminating roles — it is generating entirely new categories of work. AI ethics officers, prompt engineers, machine learning operations specialists, and AI safety researchers did not exist five years ago. The creation side of the equation is often invisible in headlines.
| Finding | Value | Source |
|---|---|---|
| New jobs created globally by 2030 (WEF) | 170M | WEF Future of Jobs Report 2025 |
| Companies creating new AI roles (WEF) | 49% | WEF Future of Jobs Report 2025 |
| AI engineer posting growth (LinkedIn) | +143% | |
| Cybersecurity analyst growth (US, BLS) | +33% | BLS Occupational Outlook Handbook |
| Nurse practitioner growth (US, BLS) | +45% | BLS Occupational Outlook Handbook |
| Wind turbine tech growth (US, BLS) | +60% | BLS Occupational Outlook Handbook |
| Solar installer growth (US, BLS) | +48% | BLS Occupational Outlook Handbook |
| Home health aide new jobs (US, BLS) | 819,500 | BLS Occupational Outlook Handbook |
| Data scientist growth (US, BLS) | +36% | BLS Occupational Outlook Handbook |
| Software developer growth (US, BLS) | +17% | BLS Occupational Outlook Handbook |
| Cybersecurity workforce gap (Global, ISC2) | 4.8M | ISC2 Cybersecurity Workforce Study 2024 |
| Global health worker shortage by 2030 (WHO) | 10M | WHO Global Strategy on Human Resources for Health |
20 Roles With the Strongest Growth
The creation story runs on two tracks. The first is new roles that did not exist before AI — AI engineers, prompt engineers, ML operations specialists, AI safety researchers, and AI ethics officers. LinkedIn reports AI engineer postings have grown significantly year-over-year. The second track is existing protected roles facing critical shortages: healthcare needs 10 million more workers globally by 2030 (WHO), construction firms cannot fill 91% of positions (AGC), cybersecurity has a 4.8 million worker gap (ISC2).
The Shortage Paradox
The sectors most protected from AI displacement are the same sectors facing the worst labour shortages. This is not a coincidence. The structural barriers that keep AI out (physical presence, licensing, trust) are the same barriers that limit labour supply:
For workers in displaced roles, these shortages represent a clear transition path. Cybersecurity certifications take 3–6 months. Trade apprenticeships pay from day one. Healthcare aide programmes run 4–12 weeks. The barrier to entering a GREEN zone career is lower than the barrier to staying relevant in a RED zone one.
Full analysis: Jobs AI Cannot Replace · Most In-Demand Jobs
🟡 Jobs Being Augmented
The largest category is neither displacement nor creation. It is transformation. The majority of workers will keep their job titles while their daily tasks change fundamentally. This is the YELLOW zone — and it covers more workers than RED and GREEN combined.
| Finding | Value | Source |
|---|---|---|
| US workers using AI at work, Q4 2025 (Gallup) | 49% | Gallup (Jan 2026) |
| METR trial: developers took longer with AI but felt faster | +19% time / −20% perceived | METR Randomized Controlled Trial (2025) |
| C-suite executives saying AI saves 4+ hours per week | 76% | 2026 Workforce Survey (5,000 workers) |
| Workers saying AI saves them zero time | 40% | 2026 Workforce Survey (5,000 workers) |
| Workers reporting AI productivity gains (Deloitte) | 66% | Deloitte AI Report (2026) |
| Organizations using AI in at least one function (McKinsey) | 88% | McKinsey State of AI (2025) |
| Developers using AI coding assistants (GitHub) | 77% | GitHub Octoverse 2024 |
1364 roles sit in the YELLOW zone (scores 33–47), representing 🇺🇸 68.1M US workers — 40% of the mapped workforce. These workers keep their job titles while their daily tasks change fundamentally. A marketing manager uses AI to generate campaign drafts. A financial analyst uses AI for first-pass reports. A software developer writes with AI coding assistants. The role persists; the work inside shifts.
The Measurement Illusion
A METR randomised controlled trial found experienced developers took 19% longer with AI coding tools — but reported feeling 20% faster. Self-reported productivity gains may not reflect reality. The gap between perceived and actual productivity is one of the defining challenges of the augmentation era.
The Executive-Worker Gap
76% of C-suite executives say AI saves them 4+ hours per week. 40% of workers say AI saves them zero time. The people furthest from day-to-day tasks report the most savings. 81% of C-suite have received AI training vs only 27% of non-managers. The workers most likely to be affected are least prepared.
What Augmentation Means for Careers
The YELLOW zone worker who masters AI tools becomes more productive and more valuable. The one who does not becomes the next headcount reduction. 49% of US workers are already using AI at work (Gallup). AI adoption is not optional for augmented roles — it is the difference between thriving and being displaced. The question is not whether AI affects your role — it is whether you direct the AI or compete with it.
The augmentation pattern reveals AI’s most common employment impact: not elimination but transformation. The headline about 300 million jobs “exposed” to AI (Goldman Sachs) is primarily an augmentation story, not a displacement story. Most of those workers will keep their titles while AI handles an increasing share of routine tasks. The career implication: invest in the skills AI amplifies (judgment, strategy, client relationships) rather than the skills AI replicates (data processing, first drafts, routine analysis).
🏭 Impact by Sector
AI impact varies dramatically by industry. Marketing leads generative AI adoption. Banking faces disruption to over a million roles. Healthcare and trades show structural resistance. The sector you work in matters more than any macro forecast.
| Domain | Avg JobZone Score |
|---|---|
| Data | 28.6 |
| Business & Operations | 29.6 |
| Manufacturing | 31.1 |
| Real Estate & Property | 34.5 |
| Cloud & Infrastructure | 35.1 |
| Development | 36.0 |
| Creative & Media | 37.2 |
| Library, Museum & Archives | 39.4 |
| Legal & Compliance | 39.7 |
| Science & Research | 40.7 |
| Retail & Service | 40.8 |
| Government & Public Admin | 42.4 |
| Engineering | 46.0 |
| Transportation | 46.4 |
| Agriculture | 48.1 |
| Cybersecurity | 49.0 |
| Education | 49.1 |
| Other | 50.5 |
| Utilities & Energy | 50.6 |
| Public Safety | 53.0 |
| Religious & Community | 54.4 |
| Social Services | 55.8 |
| AI | 56.0 |
| Sports & Recreation | 56.2 |
| Healthcare | 57.5 |
| Military | 57.6 |
| Veterinary & Animal Care | 59.8 |
| Trades & Physical | 60.5 |
| Sector | Impact | Direction | Detail | Source |
|---|---|---|---|---|
| Technology | -25% grad hiring | Mixed | Big Tech cut new-graduate hiring 25% between 2023–2024. AI coding tools adopted by 92% of developers. Restructuring, not collapse. | Goldman / GitHub 2025 |
| Banking & Finance | ~1.2M roles affected | Displacement | Algorithmic trading, AI risk analysis, and automated customer interactions driving displacement. Bookkeepers -4%, financial managers +16%. | Industry analysis 2026 |
| Manufacturing | 1.7–2M jobs at risk | Displacement | Robotics and AI-driven quality control, maintenance, and planning. 1.7M manufacturing jobs lost since 2000. | MIT/BU 2025 |
| Customer Service | 80% of tasks automatable | Displacement | AI chatbots and voice assistants projected to automate most representative duties. Klarna: 75% automated. | ILO / Industry 2023 |
| Healthcare | +12% projected growth | Growth | Up to 30% of routine tasks becoming automatable, but licensing, trust, and physical presence protect roles. Nurse practitioners +45%. | BLS 2023–2033 |
| Construction & Trades | 91% can't fill positions | Growth | Physical work, licensing, and shortage create structural protection. Electricians +11%. Wind turbine techs +60%. | AGC / BLS 2025 |
| Marketing & Creative | 37% Gen AI adoption | Mixed | Highest adoption rate of any sector. Commodity content displaced, strategic and creative roles augmented. | Statista 2025 |
| Cybersecurity | +33% analyst growth | Growth | AI expands the attack surface, creating more demand for human security professionals. 4.8M global workforce gap. | BLS / ISC2 2024 |
| Finding | Value | Source |
|---|---|---|
| Admin tasks automatable (Global, Goldman) | 46% | Goldman Sachs (2023) |
| Legal tasks automatable (Global, Goldman) | 44% | Goldman Sachs (2023) |
| Bookkeeper projected decline (US, BLS) | -4% | BLS Occupational Outlook Handbook |
| Tax preparer projected decline (US, BLS) | -4% | BLS Occupational Outlook Handbook |
| Electrician growth (US, BLS) | +11% | BLS Occupational Outlook Handbook |
| Healthcare sector projected growth (US, BLS) | +12% | BLS Occupational Outlook Handbook |
| Construction firms can't fill roles (US, AGC) | 91% | AGC Workforce Survey 2024 |
Highest Displacement Risk
- • Administrative & clerical (46% automatable)
- • Legal support (44% automatable)
- • Customer service (text-based)
- • Basic accounting & bookkeeping (-4% BLS)
- • Data entry & processing
- • Commodity content writing
Strongest Growth
- • Healthcare (+12% sector growth, NPs +45%)
- • Trades & construction (electricians +11%)
- • Cybersecurity (+33% analysts)
- • Clean energy (wind techs +60%)
- • Education & teaching
- • Emergency services
JobZone Data: Healthcare (Most Protected Sector)
379 roles assessed · 6% in RED zone
| # | Role | Zone | Score |
|---|---|---|---|
| 1 | Trauma Surgeon (Mid-to-Senior) | GREEN | 83.2 |
| 2 | Registered Nurse (Clinical/Bedside) | GREEN | 82.2 |
| 3 | Complex Family Planning Specialist (Mid-to-Senior) | GREEN | 82.0 |
| 4 | Forensic Pathologist (Mid-to-Senior) | GREEN | 81.7 |
| 5 | ICU Nurse (Mid-Level) | GREEN | 81.2 |
| 6 | Electrophysiologist — Cardiac (Mid-to-Senior) | GREEN | 80.7 |
| 7 | Interventional Cardiologist (Mid-to-Senior) | GREEN | 80.7 |
| 8 | Hospice Nurse (Mid-Level) | GREEN | 80.6 |
| 9 | Labor and Delivery Nurse (Mid-Level) | GREEN | 80.2 |
| 10 | Approved Mental Health Professional (AMHP) (Mid-Level) | GREEN | 79.9 |
JobZone Data: Cybersecurity (Critical Shortage Sector)
91 roles assessed · 8% in RED zone
| # | Role | Zone | Score |
|---|---|---|---|
| 1 | AI Safety Researcher (Mid-Senior) | GREEN | 85.2 |
| 2 | Chief Information Security Officer (CISO) (Senior/Executive) | GREEN | 83.0 |
| 3 | AI Security Engineer (Mid-Level) | GREEN | 79.3 |
| 4 | OT/ICS Security Engineer (Mid-Level) | GREEN | 73.3 |
| 5 | AI Governance Lead (Mid-Level) | GREEN | 72.3 |
| 6 | Enterprise Security Architect (Principal) | GREEN | 71.1 |
| 7 | Chief Privacy Officer (Executive/C-Suite) | GREEN | 70.6 |
| 8 | AI/ML Engineer — Cybersecurity (Mid-Level) | GREEN | 69.2 |
| 9 | Senior Security Architect (Senior) | GREEN | 67.8 |
| 10 | Cyber Security Architect (Senior) | GREEN | 66.8 |
The Bifurcation Pattern
Even within exposed sectors, impact is not uniform. In finance, bookkeepers face -4% decline while financial managers grow +16%. In tech, routine coding faces pressure while cybersecurity grows +33%. In legal, paralegals face AI replacement while trial lawyers are protected. The pattern across every sector: routine tasks shrink, complex/physical/trust-based tasks grow. The sector matters less than the type of work within the sector.
The sector data creates a clear career compass. If you are in finance, admin, or customer service — the low-scoring domains — your sector faces disproportionate AI displacement risk. If you are in healthcare, trades, or cybersecurity, the data says your sector is growing specifically because of AI adoption (more systems to secure, more infrastructure to build, more patients needing human care as AI handles administrative burden).
🌍 Impact by Country
AI exposure is not distributed evenly across nations. Service-heavy economies like the UK face higher exposure. Manufacturing-heavy economies face different risks. Developing nations risk being left behind entirely. A 2026 IMF study across six countries found roughly 10% of occupations declining in all of them.
| Finding | Value | Source |
|---|---|---|
| US workers in AI-exposed occupations (IMF, 2026) | ~60% | IMF Staff Discussion Note (2026) |
| Advanced economy exposure (Global, IMF) | 60% | International Monetary Fund (2024) |
| Emerging market AI exposure (Global, IMF) | 40% | International Monetary Fund (2024) |
| Low-income country AI exposure (Global, IMF) | 26% | International Monetary Fund (2024) |
| UK businesses using AI (ONS, 2023) | ~15% | ONS |
| World Bank: AI displacement risk (Global) | Up to 30% | World Bank / Industry synthesis |
| Country | AI Exposure | Key Finding | Source |
|---|---|---|---|
| 🇺🇸 United States | ~60% | Leading AI investment globally. 30% high-complement, 30% high-exposed, 41% low-exposure. Greater labour market stability than UK. | IMF 2026 |
| 🇬🇧 United Kingdom | ~70% | Highest share of workers in AI-exposed occupations among advanced economies. Service-heavy economy drives exposure. 35% high-complement, 32% high-exposed. | IMF 2026 |
| 🇩🇪 Germany | ~58% | Manufacturing sector particularly exposed to robotics and AI. ~28% high-complement, ~30% high-exposed. Strong apprenticeship system buffers transitions. | IMF 2026 |
| 🇨🇦 Canada | ~55% | Growing AI hub (Toronto, Montreal). Immigration-driven labour market provides buffer. Healthcare and construction shortages persist. | IMF / Statistics Canada |
| 🇦🇺 Australia | ~50% | Mining, construction, and healthcare dominate employment. Lower AI exposure due to physical-heavy economy. Skills shortage across trades and health. | IMF / ABS |
| 🇮🇳 India | ~26% | Lower direct exposure but risk of being left behind. IT services sector (5M+ workers) facing restructuring. AI data labeling jobs concentrating here. | IMF / NASSCOM |
| 🇧🇷 Brazil | — | Larger compositional changes in labour demand alongside UK. Developing economy faces different equation — lower exposure but less adaptive capacity. | IMF 2026 |
Advanced Economies
Advanced economies have 60–70% of workers in AI-exposed occupations (IMF). The UK leads at ~70%, driven by its service-heavy economy. The US sits at ~60%. Germany’s manufacturing base creates different exposure patterns. But “exposed” splits into two categories: high-complement (AI augments, ~30%) and high-risk (AI displaces, ~30%). The ratio between these two determines whether the outcome is growth or disruption.
Developing Economies
Developing countries face a different equation. India has ~26% direct AI exposure (IMF), lower than advanced economies. But the risk is being left behind as AI-leading nations accelerate growth. The White House Council of Economic Advisers warns AI could trigger a “Great Divergence” comparable to the Industrial Revolution. Some AI-adjacent jobs (data labeling, content moderation) are concentrating in developing countries — but may be automated in later waves.
Source: IMF Staff Discussion Note 2026. “High complementarity” means AI is more likely to augment workers than replace them. “Low complementarity” means higher displacement risk.
The Great Divergence Risk
The White House Council of Economic Advisers warns AI could trigger a “Great Divergence” between AI-leading and AI-lagging nations — comparable to the Industrial Revolution. Countries that adopt AI early gain productivity advantages that compound over decades. Countries that lag face a widening gap. For individual workers, the country-level story matters because policy responses (safety nets, retraining programmes, labour regulation) vary enormously. The EU AI Act creates worker protections. The US focuses on AI acceleration. Workers in each jurisdiction face different transition landscapes.
The country data reveals a consistent pattern: service-heavy economies face higher exposure (more digital, office-based roles), manufacturing-heavy economies face moderate exposure (physical work provides a buffer), and developing economies face lower direct exposure but higher systemic risk. For workers, the implication is clear: your country’s economic structure shapes your AI risk as much as your individual role does. A customer service worker in the UK (70% exposure economy) faces a different policy and support landscape than the same worker in Australia (50% exposure, strong social safety net).
👥 Impact by Demographics
AI does not affect all workers equally. Women, younger workers, and lower-wage employees face disproportionate risk. The data on who gets hit hardest is clear — and it maps directly to the types of roles each group occupies.
| Finding | Value | Source |
|---|---|---|
| Women's AI vulnerability vs 3.2% for men (Global, IMF) | 9.6% | IMF (2024) |
| Women's jobs at risk vs men (Global, WEF) | 28% vs 21% | WEF Global Gender Gap Report 2025 |
| Women needing transitions by 2030 (Global, McKinsey) | 40–160 million | McKinsey Global Institute |
| Workers with high exposure + low adaptive capacity (US, Brookings) | 6.1 million | Brookings Institution (2026) |
| Youth unemployment rate 20–24 (US, BLS) | 9.5% | BLS / Fortune |
| Employment decline for 22–25 year-olds in AI-exposed roles (Dallas Fed) | -13% | Dallas Federal Reserve (Jan 2026) |
Who Gets Hit Hardest
Women: 9.6% employment vulnerability (vs 3.2% for men, IMF) because women
are overrepresented in clerical and administrative roles that AI targets.
The WEF reports 28% of women’s jobs at risk vs 21% for men.
Young workers: Entry-level roles are automated first. The Dallas Fed found
employment declined for 22–25 year-olds in AI-exposed occupations. College grad
unemployment is rising.
Lower-wage workers: Brookings identifies 6.1 million US workers with high AI
exposure AND low adaptive capacity — disproportionately lower-wage, with less access to
retraining.
The demographic data underscores why a blanket response to AI impact is insufficient. A 25-year-old woman in an administrative role and a 45-year-old man in construction face entirely different risk profiles and need entirely different responses. The former needs AI literacy training and potential sector transition. The latter is structurally protected and needs only to adopt AI tools that augment existing skills. Aggregate statistics obscure these differences. Role-level data reveals them.
The Double Disadvantage
The workers who face the highest AI exposure have the lowest adaptive capacity. They are disproportionately lower-wage, without degrees, and without access to employer-funded retraining programmes. The AI impact on employment is not just a workforce issue — it is an equity issue. Market forces alone are unlikely to close that gap.
💰 Wage Impact
AI is reshaping the wage landscape in two directions simultaneously. Workers with AI skills command a premium. Workers in AI-exposed roles without AI skills face downward pressure. The wage gap between the two groups is widening.
| Finding | Value | Source |
|---|---|---|
| Wage premium for AI-skilled workers (Global, PwC) | 26% | PwC |
| Wage growth in AI-exposed industries (PwC) | 2× faster | PwC AI Jobs Barometer |
| Revenue per employee in AI-exposed sectors (PwC) | 2x faster | PwC AI Jobs Barometer 2025 |
| CEOs reporting AI grew revenue and cut costs (Global, PwC) | 12% | PwC CEO Survey (4,454 CEOs) |
| CEOs reporting no measurable return from AI investment (PwC) | 56% | PwC CEO Survey (4,454 CEOs) |
| Median tech wage (US, BLS) | $104,420 | BLS Occupational Outlook Handbook |
| Median wage all occupations (US, BLS) | $48,060 | BLS Occupational Employment & Wage Statistics |
AI-Skilled Workers
PwC documents a significant wage premium for AI-skilled workers. Workers who direct AI tools command higher compensation than those whose tasks AI replicates. The premium is growing as demand for AI fluency outpaces supply. LinkedIn reports AI literacy is the fastest-growing skill on the platform.
AI-Exposed Workers Without AI Skills
Workers in AI-exposed roles who have not acquired AI skills face downward wage pressure. As AI handles more routine tasks, the remaining human work is either more complex (higher wages) or more commoditised (lower wages). The middle is hollowing out. The wage gap between AI-skilled and AI-unskilled workers in the same occupation is widening.
The CEO Paradox
In a PwC survey, only 12% of CEOs said AI grew revenues and cut costs. 56% reported getting “nothing out of it.” Yet companies continue investing heavily and making workforce decisions based on AI’s potential rather than its performance. This disconnect matters for wages: if AI is not delivering measurable returns for most companies, wage pressure from AI may be more about expectation than execution.
The wage picture mirrors the three-zone framework. GREEN zone roles (physical, licensed, trust-dependent) see rising wages driven by shortage. RED zone roles (digital, pattern-based) see downward pressure as AI handles more output. YELLOW zone roles split: workers who master AI tools see premiums while those who resist face stagnation. The wage impact of AI is not uniform — it is a multiplier of existing skill differences.
📉 Unemployment Impact
Will AI raise unemployment? Goldman says a temporary blip. JPMorgan warns of structural displacement. Yale finds no measurable impact after 33 months of data. The forecasts reveal more about methodology than certainty.
| Finding | Value | Source |
|---|---|---|
| Temporary unemployment rise (Goldman) | +0.5pp | Goldman Sachs (Aug 2025) |
| Projected US unemployment from AI (Anthropic CEO) | 10–20% | Dario Amodei (May 2025) |
| JPMorgan: displacement timeline 1–3 years (US) | 3–6% | JP Morgan Private Bank |
| JPMorgan: displacement over a decade (US) | 10–15% | JP Morgan Private Bank |
| Fed unemployment forecast 2026 (US) | 4.4% | Federal Reserve |
| Current US unemployment rate (BLS) | 4.28% | BLS / Citadel Securities |
| High AI-exposure sector employment (Yale) | +1.7% | Yale Budget Lab (Jan 2026) |
| US job growth despite AI (Yale) | 15,000 | Yale Budget Lab (Feb 2026) |
| Hinton: massive unemployment likely (Global) | "Very likely" | Geoffrey Hinton (Nobel Prize, Bloomberg TV Nov 2025) |
The key disagreement: Goldman says temporary disruption resolving in 2 years. JPMorgan warns of structural displacement over a decade. Geoffrey Hinton predicts “massive unemployment.” Yale Budget Lab finds no evidence of it in 33 months of data. The current US unemployment rate sits well within the normal range despite 33+ months of ChatGPT availability.
Why the Forecasts Disagree
Goldman Sachs models assume new roles emerge quickly (2 years). JPMorgan models assume structural friction (a decade). Hinton extrapolates from AI capability growth. Yale measures actual labour market data. They are all right about different things: Goldman is right that new roles will emerge. JPMorgan is right that the transition has friction. Hinton is right that capability is accelerating. Yale is right that displacement has not shown up in aggregate unemployment yet. The operative word is “yet.”
For workers, the unemployment forecasts matter less than the sector-specific data. Aggregate unemployment could stay stable while millions transition between sectors — the same aggregate rate hiding massive disruption underneath. The question is not “will unemployment rise?” — it is “will my sector’s employment rise?”
The Hidden Displacement Pattern
Aggregate unemployment can mask sector-level disruption. If healthcare adds 2 million jobs while customer service loses 2 million, the unemployment rate stays flat. But the workers displaced from customer service do not automatically become nurses. The transition requires retraining, geographic mobility, and time. The gap between aggregate stability and individual disruption is where policy intervention matters most. Yale’s finding of no aggregate impact does not mean no impact — it means the impacts are cancelling out in aggregate while creating turbulence underneath.
🎓 Entry-Level Impact
Entry-level roles are the canary in the coal mine. They involve the most structured, repeatable tasks with the least institutional knowledge. The data shows measurable declines since 2022 — and the implications for new graduates are serious.
| Finding | Value | Source |
|---|---|---|
| Employment decline in AI-exposed entry roles (Stanford) | -16% | Stanford DEL (Brynjolfsson et al., 2025) |
| Big tech graduate hiring cuts (Goldman) | -25% | Goldman Sachs (2025) |
| Junior position postings decline (Harvard) | -7.7% | Harvard Economics (Lichtinger & Hosseini Maasoum, 2025) |
| Entry-level job postings decline (US) | -29 pp | Metaintro (126M global job postings) |
| 50% of entry-level white-collar at risk (US, Anthropic CEO) | 50% within 1–5 years | Dario Amodei (May 2025) |
| Entry-level share of job postings (Indeed) | 10% | Indeed (2025) |
| College graduate unemployment early 2026 (US) | ~10% | Goldman Sachs / Industry data |
| Entry roles now requiring 3+ years experience (US) | 35% | Metaintro (Jan 2026) |
| Gen Z: AI reduced value of degree (US) | 49% | US Gen Z survey (2025) |
Entry-level roles are being compressed from both sides: AI handles the simple tasks juniors used to learn on, while employers raise experience requirements for remaining positions. MetaIntro data shows “entry-level” postings now routinely require 3+ years of experience. This creates a catch-22 for graduates: the experience-building roles are the first to be automated.
The Graduate Career Crisis
College graduate unemployment has risen to its highest since the pandemic recovery. Big tech — historically the largest employer of new grads — has cut graduate hiring by 25%+. Gen Z workers report AI has reduced the value of their degrees. The traditional path (degree → entry-level role → career progression) is being disrupted at the first step.
For career planning, the entry-level data points toward two strategies: (1) gain AI skills alongside traditional qualifications, making yourself AI-augmented rather than AI-replaceable, or (2) target entry-level roles in GREEN zone sectors (healthcare, trades, education) where the human element is the entry requirement, not the obstacle.
Full analysis: AI Replacing Entry-Level Jobs
📜 Historical Parallels
Every automation wave has triggered the same fear. And every time, the economy created more jobs than it destroyed — eventually. The question with AI is whether the transition is faster than reskilling systems can respond.
ATMs & Bank Tellers
ATMs reduced tellers per branch from 21 to 13. But cheaper branches meant banks opened more. Teller employment increased from 300,000 to 500,000 between 1970 and 2010. The technology shifted the role from cash handling to relationship banking.
Power Loom & Textile Workers
The power loom automated 98% of manual weaving. Yet textile employment grew because lower costs created massive new demand. Cloth went from luxury to commodity, and the industry needed more workers doing different tasks.
Spreadsheets & Bookkeepers
VisiCalc and Lotus 1-2-3 automated manual calculation. Bookkeeper employment declined — but financial analyst roles exploded. BLS still projects bookkeepers declining while financial managers grow. Same pattern, different decade, different technology.
E-Commerce & Retail
E-commerce was supposed to eliminate retail. Instead, it restructured it. Physical retail declined in department stores but grew in logistics and delivery. Amazon alone employs 1.5 million people — most in physical warehouse roles. Technology shifted where the jobs were, not whether they existed.
The Speed Question
Every historical parallel eventually created more jobs than it destroyed. But the timelines varied: agricultural mechanisation took 150 years. ATMs took 40 years. Spreadsheets took 20. E-commerce took 15. If AI follows the acceleration pattern, the transition could happen in 5–10 years — potentially faster than reskilling infrastructure can respond. This is the core risk: not that the economy will not create new roles, but that it might not create them fast enough.
The historical data provides one consistent reassurance: roles requiring physical presence, licensing, and human trust have grown through every automation wave. Nurses, electricians, teachers, and firefighters exist today in larger numbers than before any previous technology. The same traits that protected them from steam, electricity, and computing protect them from AI.
What Is Different This Time
AI differs from previous automation in three ways that matter for employment forecasts:
- • Cognitive tasks, not physical: Previous automation targeted physical labour. AI targets cognitive, white-collar tasks. For the first time, university-educated workers in office-based roles face displacement pressure. This affects a different demographic than any previous wave.
- • Speed of capability growth: Agricultural mechanisation took 150 years. AI capability doubles on much shorter cycles. The gap between “AI can do this” and “AI is deployed for this” is compressing with each generation of models.
- • General-purpose capability: Previous automation tools were task-specific. A loom weaves; it does not do accounting. AI is general-purpose: the same foundation model that writes marketing copy can also analyse legal contracts and generate code. This breadth of capability has no historical precedent.
The historical parallels provide optimism about long-term outcomes (more jobs created than destroyed) but not about short-term transitions. The speed and breadth of AI mean the transition period could be shorter and more disruptive than any previous wave.
🤖 The Adoption Timeline
The gap between AI capability and AI deployment is the most important dynamic in the employment story. Companies spent over $250 billion on AI in 2024 — but 42% abandoned most pilot projects. The productivity paradox is real.
| Finding | Value | Source |
|---|---|---|
| Total corporate AI spending in 2024 (Global) | $250B+ | Industry data (2024) |
| Companies that abandoned most AI pilot projects by end 2024 (Global) | 42% | McKinsey State of AI (2024) |
| Organizations using AI in at least one function (Stanford) | 78% | Stanford HAI AI Index 2025 |
| Companies with mature AI deployment at scale (McKinsey) | 1% | McKinsey State of AI (2024) |
| US adults using generative AI daily (St. Louis Fed) | 12% | St. Louis Fed |
| US workers using AI at work (Gallup) | 49% | Gallup (Jan 2026) |
The Productivity Paradox
Companies spent over $250 billion on AI in 2024. In a PwC survey, 56% of CEOs reported getting “nothing out of it.” By the end of 2024, 42% of companies had abandoned most AI pilot projects. The gap between AI investment and measurable results is the most important dynamic in the employment story right now.
The J-Curve Hypothesis
Some economists argue we are in the early phase of a J-curve — an initial productivity slowdown as organisations reorganise, followed by exponential gains. The internet followed this pattern in the late 1990s. If AI follows the same curve, the employment impact is front-loaded (disruption now) with benefits arriving later.
Impact Timeline
Now — 2027: The Freelance & Entry-Level Wave
Already happening. Freelance writing, design, and development are measurably displaced. Entry-level white-collar roles face declining postings. Big tech graduate hiring is down. Customer service roles are being automated. This wave hits digital-first, unprotected, pattern-based work.
2027 — 2030: The Headcount Wave
As AI deployment matures beyond pilots, companies will restructure teams around AI productivity. 10-person teams become 3-person teams. The role title persists but headcount shrinks. This is McKinsey’s 12 million occupational transitions. It shows up as flat hiring, not mass layoffs — harder to measure, equally disruptive.
2030+: The New Equilibrium
If historical patterns hold, the economy will have created more roles than it destroyed. Healthcare, trades, clean energy, cybersecurity, and AI-adjacent roles will have expanded. The WEF projects +78M net new jobs. But the transition between now and then is where the human cost lives — and the reskilling investment determines whether that cost falls on workers or is absorbed by institutions.
Three Friction Factors Slow Adoption
- • Regulatory lag: AI can read medical images, but FDA approval for autonomous diagnosis takes years. AI can draft legal documents, but bar associations have not authorised AI to practise law. Capability precedes permission by 3–10 years in regulated sectors.
- • Integration cost: Deploying AI at enterprise scale requires data migration, system integration, change management, and security review. Most enterprises are still in pilot phase. The gap between “AI can do this task” and “our company uses AI for this task” is 2–5 years.
- • Human resistance: Executives who made early AI cuts regret the decision (Forrester). Organisations that cut too fast lose institutional knowledge. The deployment curve is slower than the capability curve because humans slow it down — sometimes wisely.
🎯 Skills & Reskilling
The buffer between AI capability and actual job loss is training. Workers who gain AI skills move into augmented roles. Workers who do not face both displacement risk and reduced employability. The dividing line is training, not talent.
| Finding | Value | Source |
|---|---|---|
| Workers needing reskilling by 2027 (WEF) | 60% | World Economic Forum |
| Workers needing retraining within 3 years (WEF) | 120M+ | WEF Future of Jobs Report 2025 |
| Employees with zero AI training (Global, IDC) | 67% | IDC / Iternal |
| Enterprises with critical AI skills shortage (Global, IDC) | 90% | IDC |
| AI fluency demand increase (Global, McKinsey) | 7x | McKinsey (Nov 2025) |
| AI literacy: fastest-growing skill (LinkedIn) | #1 | |
| Non-manager employees who have received AI training | 27% | 2026 Workforce Survey (5,000 workers) |
| C-suite executives who have received AI training | 81% | 2026 Workforce Survey (5,000 workers) |
| Global talent deficit by 2030 (Korn Ferry) | 85.2M | Korn Ferry Future of Work |
| Annual cost of skills gaps (US, Deloitte) | $1.2T | Deloitte / National Association of Manufacturers |
| Workers needing upskilling by 2030 (Goldman) | 40%+ | Goldman Sachs (Aug 2025) |
The training gap is the most actionable finding in this entire article. 81% of C-suite executives have received AI training. Only 27% of non-manager employees have. The workers most likely to be displaced are the least prepared. The WEF estimates 120 million workers need retraining in the next three years — but the WEF itself acknowledges that automation has become “significantly cheaper than mass upskilling and reskilling,” creating a dangerous incentive asymmetry.
For Workers in Exposed Roles
Start with AI literacy — LinkedIn reports it is the fastest-growing skill on the platform. Then specialise: learn to use AI tools in your domain. The goal is to become the human who directs AI, not the human AI replaces. The PwC wage premium for AI-skilled workers is the market’s signal.
For Workers Considering a Sector Change
Protected sectors have faster entry paths than most people assume. Cybersecurity certifications take 3–6 months. Trade apprenticeships pay from day one. Healthcare aide programmes run 4–12 weeks. Korn Ferry projects an 85 million worker talent deficit by 2030 — concentrated in AI-resistant sectors. The barriers to entering a GREEN zone career are lower than the barriers to staying relevant in a RED zone one.
The Training Window
The WEF says 59% of the workforce needs reskilling by 2027. That is less than two years away. IDC reports most employees have received zero AI training. The window for proactive reskilling is narrow — and the cost of skills gaps in the US alone runs into billions annually (Deloitte). Workers who reskill now will be positioned for the augmented economy. Workers who wait will face both displacement and a skills gap simultaneously.
📈 What the Forecasts Say
Every major institution has published AI impact estimates. The range is staggering: from 78 million net new jobs (WEF) to 300 million exposed (Goldman Sachs). Understanding what each number actually measures is critical to making sense of the data.
| Finding | Value | Source |
|---|---|---|
| Jobs exposed globally (Goldman Sachs) | 300 million | Goldman Sachs |
| US workforce displacement range (Goldman) | 6–7% (range 3–14%) | Goldman Sachs (Aug 2025) |
| Global jobs exposed to AI (IMF) | 40% | International Monetary Fund (2024) |
| Jobs displaced by 2030 (Global, WEF) | 92M | WEF Future of Jobs Report 2025 |
| New jobs created by 2030 (Global, WEF) | 170M | WEF Future of Jobs Report 2025 |
| Net new jobs by 2030 (Global, WEF) | +78 million | WEF Future of Jobs Report 2025 |
| US workers needing transitions by 2030 (McKinsey) | 12 million | McKinsey Global Institute |
| US work hours automatable by 2030 (McKinsey) | 30% | McKinsey Global Institute |
| Jobs automatable by mid-2030s (Global, PwC) | Up to 30% | PwC |
| US work performable by AI agents + robots (McKinsey) | 57% | McKinsey Global Institute (2025) |
| Timeline for 50% task automation (Goldman) | By 2045 | Goldman Sachs |
| US jobs automatable by 2030 (Northwestern) | 30% | National University |
How to Read These Forecasts
The numbers vary by 50x because each institution measures a different thing:
- • Goldman Sachs 300M “exposed”: Jobs where AI can perform ≥50% of tasks. “Exposed” does not mean “eliminated.” Goldman itself projects displacement resolving within 2 years as new roles emerge.
- • WEF 92M displaced by 2030: Offset by 170M new roles created, yielding a net gain of 78M. The displacement figure without the creation figure is misleading.
- • McKinsey 12M US transitions: Workers who will need to change occupations, not workers who will be unemployed. McKinsey models assume most will transition successfully.
- • PwC 30% automatable by mid-2030s: The broadest timeframe. Automatable does not mean automated — regulatory, integration, and trust barriers slow adoption.
Forecast Timeline
Near-Term (2025–2027)
- • Anthropic CEO: 50% of entry-level white-collar roles at risk within 1–5 years
- • Goldman Sachs: 50% task automation by 2045, but displacement resolves within 2 years per wave
- • WEF: 59% of workforce needs reskilling by 2027
- • JPMorgan: Structural displacement within 1–3 years for digital-first roles
Medium-Term (2027–2035)
- • WEF: 92M roles displaced, 170M created (+78M net) by 2030
- • McKinsey: 12M US occupational transitions needed by 2030
- • PwC: 30% of jobs automatable by mid-2030s
- • Northwestern: 4.6M US jobs automatable by 2030
Why the Numbers Diverge: Methodology Matters
Task-Based Models (Goldman, McKinsey, MIT)
Break each occupation into tasks, estimate what AI can perform. Goldman’s 300M counts any role where AI handles ≥50% of tasks. The strength: granular, evidence-based. The weakness: performing a task in a lab differs from deploying it in a workplace.
Occupation-Based Models (WEF, OECD, SHRM)
Classify entire occupations as exposed or protected. WEF surveys 800+ employers. SHRM estimates 6% at high risk. The strength: captures employer intent. The weakness: treats each occupation as a monolith when risk varies by employer and seniority.
Our AIJRI methodology bridges these approaches by scoring each role across five dimensions then mapping scores to BLS employment data. This produces a more actionable output: not “300M exposed” or “6% at high risk” but a specific score for each of 3649 roles, mapped to 🇺🇸 170.5M real US workers. The institutional forecasts set the range. Our data narrows it to your role.
✅ The Bottom Line
The impact of AI on employment is three stories running simultaneously. 🇺🇸 44.3M US workers (26%) are in roles where AI can already perform the majority of core tasks — displacement is real and accelerating. 🇺🇸 68.1M US workers (40%) are in roles being transformed but not eliminated — AI changes the work, not the employment. 🇺🇸 56.2M US workers (33%) are structurally protected by physical presence, licensing, and trust.
The institutional forecasts agree on one thing: the transition is happening. They disagree on speed and severity. The measured data shows displacement that is real but narrow — concentrated in freelance, entry-level, and anticipatory corporate layoffs. The creation data shows massive shortages in protected sectors. The augmentation data shows a majority of workers whose titles survive while their tasks transform.
What to Do With This Data
If your role is digital-first, pattern-based, and unregulated: the displacement risk is real. The timeline is years, not decades. Start building AI skills or transition toward protected sectors (healthcare, trades, cybersecurity, engineering).
If your role is being augmented (YELLOW zone): master the AI tools in your domain. The YELLOW zone worker who directs AI becomes more valuable. The one who ignores it becomes the next headcount reduction. The wage premium for AI-skilled workers is growing.
If your role requires physical presence, licensing, or human trust: the data says you are structurally protected. AI will change your tools but not your employment. Focus on mastering AI tools that make you more productive.
Check where your role sits: Search 3649 assessed roles →

What's your AI risk score?
We're building a free tool that analyses your career against millions of data points and gives you a personal risk score with transition paths. We'll only build it if there's demand.
No spam. We'll only email you if we build it.

The AI-Proof Career Guide
We've found clear patterns in the data about what actually protects careers from disruption. We'll publish it free — but only if people want it.
No spam. We'll only email you if we write it.
About This Data
Internal data: 3649 roles scored using the AIJRI methodology v3. Scores range 0–100. RED <33 (displacement risk), YELLOW 33–47 (augmentation), GREEN 48+ (structurally protected). Employment data from BLS OEWS covering 170.5M workers (100% of the US workforce).
External data: 113+ statistics from the IMF, WEF, Goldman Sachs, McKinsey, Harvard, Stanford, PwC, OECD, SHRM, BLS, ISC2, WHO, Forrester, and leading universities. All external statistics are cited with source, year, and geographic scope.
Related: AI and Job Loss · Jobs AI Cannot Replace · Jobs Most at Risk · Most In-Demand Jobs · AI & Entry-Level Jobs · Jobs AI Will Replace by 2030
About the Authors

Nathan House
AI and cybersecurity expert with 30 years of hands-on experience. Nathan founded StationX (500,000+ students) and built JobZone Risk to ensure people invest their career development in the right direction.

StationX HAL
Custom AI infrastructure built by Nathan House for StationX. HAL co-develops JobZone Risk end-to-end: the scoring methodology, the assessment pipeline, every role assessment, and the statistical analysis that powers these articles — all directed by Nathan.