Press & Media Kit
Everything journalists need to cover JobZone Risk — the AI job displacement scoring system.
AI Displacement by State
AI Displacement by US State
Localise the story: how many workers in each state face AI displacement? Select a state to see its zone breakdown.
The US has the highest services-sector share of any major economy (79%). Retail, food service, clerical, and admin roles employ tens of millions of workers — and these routine, rules-based jobs are overwhelmingly classified RED. Meanwhile, healthcare, skilled trades, and education keep roughly 40% of workers in the GREEN zone.
All 51 Ranked by RED Zone %
| # | State | Green | Yellow | Red | Workers |
|---|---|---|---|---|---|
| 1 | South Carolina | 28.5% | 39.0% | 32.4% | 2.3M |
| 2 | Mississippi | 31.1% | 36.7% | 32.2% | 1.1M |
| 3 | Tennessee | 27.9% | 40.1% | 32.0% | 3.3M |
| 4 | New Hampshire | 29.4% | 38.6% | 32.0% | 666K |
| 5 | Indiana | 28.3% | 39.7% | 32.0% | 3.2M |
| 6 | Georgia | 26.7% | 41.3% | 32.0% | 4.8M |
| 7 | South Dakota | 32.7% | 35.5% | 31.8% | 447K |
| 8 | Kentucky | 28.4% | 39.8% | 31.8% | 2.0M |
| 9 | Michigan | 28.3% | 40.0% | 31.6% | 4.4M |
| 10 | Alabama | 29.8% | 38.7% | 31.5% | 2.1M |
| 11 | Utah | 28.6% | 40.2% | 31.3% | 1.7M |
| 12 | Kansas | 31.2% | 37.8% | 31.0% | 1.4M |
| 13 | Arkansas | 30.1% | 38.9% | 31.0% | 1.3M |
| 14 | New Mexico | 33.3% | 35.8% | 31.0% | 842K |
| 15 | Oklahoma | 30.2% | 38.8% | 31.0% | 1.7M |
| 16 | North Carolina | 29.9% | 39.2% | 30.9% | 4.9M |
| 17 | Iowa | 29.7% | 39.4% | 30.8% | 1.6M |
| 18 | Delaware | 29.6% | 39.7% | 30.7% | 461K |
| 19 | Nebraska | 31.4% | 37.9% | 30.7% | 1.0M |
| 20 | Wisconsin | 29.7% | 39.8% | 30.5% | 2.9M |
| 21 | Idaho | 30.1% | 39.5% | 30.4% | 828K |
| 22 | New Jersey | 30.9% | 38.8% | 30.3% | 4.2M |
| 23 | Florida | 28.6% | 41.1% | 30.3% | 9.8M |
| 24 | Texas | 29.9% | 40.0% | 30.1% | 13.7M |
| 25 | Arizona | 30.3% | 39.6% | 30.1% | 3.2M |
| 26 | Missouri | 30.9% | 39.0% | 30.0% | 2.9M |
| 27 | Ohio | 29.7% | 40.4% | 29.9% | 5.5M |
| 28 | Washington | 32.3% | 37.9% | 29.8% | 3.5M |
| 29 | Maine | 33.4% | 37.0% | 29.6% | 627K |
| 30 | Hawaii | 29.4% | 41.0% | 29.6% | 605K |
| 31 | Oregon | 29.3% | 41.2% | 29.5% | 1.9M |
| 32 | North Dakota | 34.5% | 36.2% | 29.3% | 417K |
| 33 | Vermont | 33.7% | 37.1% | 29.2% | 293K |
| 34 | Minnesota | 32.1% | 38.8% | 29.1% | 2.9M |
| 35 | Montana | 33.3% | 37.6% | 29.1% | 501K |
| 36 | Colorado | 30.9% | 40.0% | 29.1% | 2.9M |
| 37 | Nevada | 27.4% | 43.6% | 29.0% | 1.5M |
| 38 | Virginia | 31.3% | 39.8% | 28.8% | 4.0M |
| 39 | West Virginia | 35.9% | 35.4% | 28.7% | 695K |
| 40 | Maryland | 30.7% | 40.7% | 28.6% | 2.7M |
| 41 | California | 30.9% | 40.6% | 28.5% | 18.0M |
| 42 | Alaska | 34.9% | 36.6% | 28.5% | 313K |
| 43 | Illinois | 29.6% | 42.0% | 28.5% | 6.0M |
| 44 | Rhode Island | 31.9% | 39.9% | 28.2% | 473K |
| 45 | Louisiana | 33.2% | 39.0% | 27.9% | 1.9M |
| 46 | Connecticut | 31.8% | 40.4% | 27.8% | 1.7M |
| 47 | Pennsylvania | 32.8% | 39.5% | 27.7% | 6.0M |
| 48 | District of Columbia | 26.2% | 46.5% | 27.4% | 685K |
| 49 | New York | 35.6% | 37.2% | 27.2% | 9.5M |
| 50 | Wyoming | 35.7% | 37.2% | 27.1% | 274K |
| 51 | Massachusetts | 33.8% | 39.9% | 26.3% | 3.6M |
State estimates derived from BLS Occupational Employment and Wage Statistics (May 2024) cross-referenced with JobZone zone classifications. Employment counts represent jobs, not individuals. Zone percentages reflect the occupational composition of each state’s workforce.
AI Displacement by Region
AI Displacement by United Kingdom
Localise the story: how many workers in each region face AI displacement? Select a region to see its zone breakdown.
The UK’s services sector (83%) is the largest of any economy we track, but its composition differs from the US — a stronger NHS and public-sector healthcare workforce provides GREEN protection. Financial services, retail, and public-sector admin still drive significant RED exposure at levels comparable to (though slightly below) the US.
All 12 Ranked by RED Zone %
| # | Region | Green | Yellow | Red | Workers |
|---|---|---|---|---|---|
| 1 | London | 31.4% | 33.9% | 34.7% | 5.3M |
| 2 | South East | 34.6% | 33.7% | 31.7% | 4.0M |
| 3 | East of England | 35.2% | 34.0% | 30.9% | 2.8M |
| 4 | South West | 35.5% | 34.0% | 30.5% | 2.5M |
| 5 | North West | 35.7% | 34.1% | 30.2% | 3.3M |
| 6 | Scotland | 35.9% | 33.9% | 30.2% | 2.5M |
| 7 | North East | 36.2% | 34.1% | 29.7% | 1.1M |
| 8 | Yorkshire & Humber | 36.1% | 34.2% | 29.7% | 2.5M |
| 9 | West Midlands | 36.4% | 34.1% | 29.5% | 2.6M |
| 10 | East Midlands | 36.5% | 34.2% | 29.3% | 2.1M |
| 11 | Wales | 36.4% | 34.4% | 29.2% | 1.4M |
| 12 | Northern Ireland | 36.7% | 34.3% | 29.0% | 820K |
AI Displacement by Region
AI Displacement by Europe
Localise the story: how many workers in each region face AI displacement? Select a region to see its zone breakdown.
Europe’s lower services share (73%) and stronger manufacturing base shift more workers into YELLOW — roles that will be augmented rather than replaced. Countries like Germany and Italy retain significant industrial employment. Agriculture (3.3%) and traditional trades also contribute to a broader GREEN base.
All 29 Ranked by RED Zone %
| # | Region | Green | Yellow | Red | Workers |
|---|---|---|---|---|---|
| 1 | Luxembourg | 34.0% | 35.0% | 31.0% | 275K |
| 2 | United Kingdom | 35.0% | 35.0% | 30.0% | 29.0M |
| 3 | Netherlands | 35.0% | 35.0% | 30.0% | 9.2M |
| 4 | France | 36.0% | 35.0% | 29.0% | 27.0M |
| 5 | Belgium | 36.0% | 35.0% | 29.0% | 4.6M |
| 6 | Sweden | 36.0% | 35.0% | 29.0% | 5.0M |
| 7 | Switzerland | 36.0% | 35.0% | 29.0% | 4.7M |
| 8 | Denmark | 36.0% | 35.0% | 29.0% | 2.8M |
| 9 | Norway | 36.0% | 35.0% | 29.0% | 2.6M |
| 10 | Ireland | 36.0% | 35.0% | 29.0% | 2.3M |
| 11 | Cyprus | 36.0% | 35.0% | 29.0% | 360K |
| 12 | Germany | 37.0% | 35.0% | 28.0% | 45.0M |
| 13 | Spain | 37.0% | 35.0% | 28.0% | 18.5M |
| 14 | Greece | 37.0% | 35.0% | 28.0% | 3.4M |
| 15 | Finland | 37.0% | 35.0% | 28.0% | 2.4M |
| 16 | Italy | 38.0% | 35.0% | 27.0% | 20.5M |
| 17 | Portugal | 38.0% | 35.0% | 27.0% | 4.5M |
| 18 | Austria | 38.0% | 35.0% | 27.0% | 4.1M |
| 19 | Croatia | 38.0% | 35.0% | 27.0% | 1.4M |
| 20 | Lithuania | 38.0% | 35.0% | 27.0% | 1.2M |
| 21 | Latvia | 38.0% | 35.0% | 27.0% | 780K |
| 22 | Estonia | 38.0% | 35.0% | 27.0% | 620K |
| 23 | Poland | 39.0% | 35.0% | 26.0% | 15.5M |
| 24 | Hungary | 39.0% | 35.0% | 26.0% | 4.0M |
| 25 | Bulgaria | 39.0% | 35.0% | 26.0% | 2.5M |
| 26 | Slovakia | 39.0% | 35.0% | 26.0% | 2.3M |
| 27 | Slovenia | 39.0% | 35.0% | 26.0% | 900K |
| 28 | Czechia | 40.0% | 35.0% | 25.0% | 4.9M |
| 29 | Romania | 41.0% | 35.0% | 24.0% | 7.5M |
AI Displacement by Region
AI Displacement by Germany
Localise the story: how many workers in each region face AI displacement? Select a region to see its zone breakdown.
Germany’s industrial strength — 26% of employment vs. 19% in the US — is the key differentiator. Manufacturing, engineering, and skilled trades roles sit mostly in YELLOW and GREEN. However, Germany’s large admin and financial-services sector still generates significant RED exposure.
All 16 Ranked by RED Zone %
| # | Region | Green | Yellow | Red | Workers |
|---|---|---|---|---|---|
| 1 | Berlin | 33.1% | 34.1% | 32.8% | 1.8M |
| 2 | Hamburg | 33.1% | 34.4% | 32.5% | 1.0M |
| 3 | Hessen | 34.2% | 34.6% | 31.2% | 3.3M |
| 4 | Bayern | 34.5% | 34.8% | 30.7% | 7.4M |
| 5 | Bremen | 34.7% | 34.7% | 30.6% | 320K |
| 6 | Baden-Württemberg | 34.7% | 34.7% | 30.5% | 5.9M |
| 7 | Nordrhein-Westfalen | 35.0% | 34.9% | 30.1% | 8.9M |
| 8 | Rheinland-Pfalz | 35.7% | 35.3% | 29.0% | 2.0M |
| 9 | Niedersachsen | 35.9% | 35.2% | 29.0% | 4.0M |
| 10 | Schleswig-Holstein | 35.5% | 35.7% | 28.8% | 1.4M |
| 11 | Sachsen | 36.0% | 35.9% | 28.1% | 2.0M |
| 12 | Thüringen | 36.4% | 35.7% | 27.9% | 1.0M |
| 13 | Saarland | 36.7% | 35.4% | 27.9% | 480K |
| 14 | Brandenburg | 36.2% | 35.9% | 27.9% | 1.1M |
| 15 | Sachsen-Anhalt | 36.5% | 35.9% | 27.6% | 1.0M |
| 16 | Mecklenburg-Vorpommern | 36.4% | 36.1% | 27.5% | 750K |
AI Displacement by Region
AI Displacement by Japan
Localise the story: how many workers in each region face AI displacement? Select a region to see its zone breakdown.
Japan has the smallest RED zone among major economies. Its unique combination of a large manufacturing sector (23%), strong robotics industry, and cultural emphasis on job retention means more workers sit in GREEN and YELLOW.
All 47 Ranked by RED Zone %
| # | Region | Green | Yellow | Red | Workers |
|---|---|---|---|---|---|
| 1 | Tokyo | 32.9% | 34.9% | 32.2% | 7.7M |
| 2 | Osaka | 34.6% | 35.6% | 29.8% | 4.2M |
| 3 | Kanagawa | 34.5% | 35.8% | 29.8% | 4.3M |
| 4 | Saitama | 34.5% | 35.7% | 29.8% | 3.4M |
| 5 | Kyoto | 34.5% | 35.7% | 29.7% | 1.2M |
| 6 | Chiba | 34.5% | 35.8% | 29.7% | 2.9M |
| 7 | Hyogo | 35.0% | 35.9% | 29.2% | 2.5M |
| 8 | Aichi | 34.9% | 35.9% | 29.1% | 3.8M |
| 9 | Fukuoka | 35.0% | 35.9% | 29.1% | 2.4M |
| 10 | Miyagi | 35.2% | 35.9% | 28.9% | 1.1M |
| 11 | Hiroshima | 35.2% | 36.2% | 28.6% | 1.3M |
| 12 | Ishikawa | 35.0% | 36.7% | 28.3% | 540K |
| 13 | Ibaraki | 35.3% | 36.4% | 28.3% | 1.4M |
| 14 | Hokkaido | 35.5% | 36.2% | 28.3% | 2.4M |
| 15 | Nara | 35.4% | 36.3% | 28.2% | 570K |
| 16 | Tochigi | 35.4% | 36.5% | 28.0% | 920K |
| 17 | Gunma | 35.4% | 36.5% | 28.0% | 920K |
| 18 | Shizuoka | 35.6% | 36.3% | 28.0% | 1.8M |
| 19 | Okinawa | 36.2% | 35.8% | 28.0% | 650K |
| 20 | Okayama | 35.6% | 36.4% | 28.0% | 890K |
| 21 | Shiga | 35.5% | 36.5% | 28.0% | 665K |
| 22 | Fukushima | 36.0% | 36.4% | 27.6% | 870K |
| 23 | Kagawa | 35.8% | 36.7% | 27.6% | 450K |
| 24 | Toyama | 35.6% | 36.9% | 27.5% | 520K |
| 25 | Mie | 36.1% | 36.4% | 27.5% | 840K |
| 26 | Niigata | 36.2% | 36.4% | 27.5% | 1.1M |
| 27 | Shimane | 35.8% | 36.8% | 27.4% | 310K |
| 28 | Gifu | 36.0% | 36.6% | 27.4% | 950K |
| 29 | Nagano | 35.9% | 36.7% | 27.3% | 980K |
| 30 | Iwate | 36.1% | 36.6% | 27.3% | 590K |
| 31 | Fukui | 36.4% | 36.4% | 27.3% | 385K |
| 32 | Yamanashi | 36.0% | 36.8% | 27.3% | 400K |
| 33 | Kumamoto | 36.1% | 36.6% | 27.3% | 800K |
| 34 | Tokushima | 36.1% | 36.7% | 27.2% | 335K |
| 35 | Wakayama | 36.2% | 36.7% | 27.1% | 425K |
| 36 | Oita | 36.3% | 36.7% | 27.0% | 540K |
| 37 | Yamaguchi | 36.3% | 36.8% | 26.9% | 620K |
| 38 | Ehime | 36.3% | 36.8% | 26.9% | 620K |
| 39 | Saga | 36.3% | 36.8% | 26.9% | 375K |
| 40 | Tottori | 36.2% | 36.9% | 26.9% | 260K |
| 41 | Aomori | 36.6% | 36.6% | 26.8% | 590K |
| 42 | Miyazaki | 36.5% | 36.7% | 26.7% | 490K |
| 43 | Yamagata | 36.3% | 36.9% | 26.7% | 520K |
| 44 | Nagasaki | 36.4% | 36.9% | 26.7% | 585K |
| 45 | Kagoshima | 36.5% | 36.9% | 26.6% | 740K |
| 46 | Kochi | 36.6% | 36.9% | 26.5% | 325K |
| 47 | Akita | 36.8% | 36.8% | 26.4% | 440K |
AI Displacement by Region
AI Displacement by Canada
Localise the story: how many workers in each region face AI displacement? Select a region to see its zone breakdown.
Canada closely mirrors the US pattern — a large services sector (80%) creates similar RED exposure through retail, admin, and customer-service roles. Strong natural-resources and healthcare sectors provide GREEN protection.
All 13 Ranked by RED Zone %
| # | Region | Green | Yellow | Red | Workers |
|---|---|---|---|---|---|
| 1 | British Columbia | 34.7% | 32.8% | 32.5% | 2.6M |
| 2 | Ontario | 34.9% | 32.8% | 32.2% | 7.7M |
| 3 | Northwest Territories | 32.0% | 36.0% | 32.0% | 25K |
| 4 | Alberta | 34.9% | 33.2% | 31.9% | 2.4M |
| 5 | Quebec | 35.1% | 33.0% | 31.9% | 4.3M |
| 6 | Yukon | 36.4% | 31.8% | 31.8% | 22K |
| 7 | Nova Scotia | 35.2% | 33.5% | 31.3% | 460K |
| 8 | Saskatchewan | 35.5% | 33.4% | 31.1% | 560K |
| 9 | Manitoba | 35.8% | 33.3% | 30.9% | 660K |
| 10 | New Brunswick | 35.6% | 33.6% | 30.8% | 360K |
| 11 | Prince Edward Island | 34.6% | 34.6% | 30.8% | 78K |
| 12 | Nunavut | 38.5% | 30.8% | 30.8% | 13K |
| 13 | Newfoundland & Labrador | 35.9% | 33.6% | 30.5% | 220K |
AI Displacement by Region
AI Displacement by Australia
Localise the story: how many workers in each region face AI displacement? Select a region to see its zone breakdown.
Australia’s economy is structurally similar to Canada and the US, with a dominant services sector (78%). Mining and natural resources provide some GREEN insulation, but the large retail, hospitality, and financial-services workforce drives RED percentages comparable to the UK.
All 8 Ranked by RED Zone %
| # | Region | Green | Yellow | Red | Workers |
|---|---|---|---|---|---|
| 1 | Australian Capital Territory | 32.1% | 32.1% | 35.8% | 240K |
| 2 | Northern Territory | 35.0% | 32.5% | 32.5% | 120K |
| 3 | Victoria | 34.9% | 32.8% | 32.3% | 3.5M |
| 4 | New South Wales | 34.7% | 33.0% | 32.3% | 4.1M |
| 5 | Western Australia | 34.9% | 33.2% | 31.9% | 1.4M |
| 6 | Queensland | 35.5% | 33.3% | 31.2% | 2.6M |
| 7 | South Australia | 35.6% | 33.5% | 30.9% | 860K |
| 8 | Tasmania | 36.4% | 33.5% | 30.2% | 242K |
AI Displacement by Region
AI Displacement by South Korea
Localise the story: how many workers in each region face AI displacement? Select a region to see its zone breakdown.
South Korea’s significant manufacturing sector (24%) — especially electronics, automotive, and shipbuilding — places more workers in the YELLOW adaptation zone. Higher agriculture (5.2%) compared to other advanced economies adds a small GREEN buffer.
All 17 Ranked by RED Zone %
| # | Region | Green | Yellow | Red | Workers |
|---|---|---|---|---|---|
| 1 | Seoul | 34.5% | 34.1% | 31.5% | 5.3M |
| 2 | Gyeonggi | 35.6% | 34.8% | 29.6% | 7.0M |
| 3 | Daejeon | 35.8% | 34.7% | 29.4% | 720K |
| 4 | Sejong | 36.1% | 35.0% | 28.9% | 180K |
| 5 | Incheon | 36.1% | 35.1% | 28.8% | 1.4M |
| 6 | Busan | 36.4% | 35.2% | 28.4% | 1.6M |
| 7 | Gwangju | 36.6% | 35.1% | 28.2% | 680K |
| 8 | Daegu | 36.6% | 35.2% | 28.2% | 1.1M |
| 9 | South Chungcheong | 36.5% | 35.7% | 27.8% | 1.0M |
| 10 | Ulsan | 36.9% | 35.5% | 27.6% | 510K |
| 11 | South Gyeongsang | 36.9% | 35.7% | 27.4% | 1.5M |
| 12 | North Chungcheong | 37.2% | 35.5% | 27.3% | 740K |
| 13 | Gangwon | 37.3% | 35.8% | 26.9% | 670K |
| 14 | North Gyeongsang | 37.5% | 35.8% | 26.7% | 1.2M |
| 15 | North Jeolla | 37.6% | 35.9% | 26.5% | 800K |
| 16 | Jeju | 37.4% | 36.1% | 26.5% | 310K |
| 17 | South Jeolla | 37.9% | 36.2% | 25.9% | 810K |
AI Displacement by Region
AI Displacement by Global
Localise the story: how many workers in each region face AI displacement? Select a region to see its zone breakdown.
The global average has a larger GREEN zone and significantly smaller RED zone than advanced economies. Agriculture employs 26% of the world’s workers in roles with physical and environmental complexity that resists near-term automation. Lower-income economies have less services-sector employment, which substantially reduces RED exposure — consistent with IMF estimates that low-income countries face roughly half the AI displacement risk of advanced economies.
All 30 Ranked by RED Zone %
| # | Region | Green | Yellow | Red | Workers |
|---|---|---|---|---|---|
| 1 | Canada | 35.0% | 33.0% | 32.0% | 19.0M |
| 2 | Australia | 35.0% | 33.0% | 32.0% | 13.1M |
| 3 | United Kingdom | 35.0% | 34.0% | 31.0% | 29.0M |
| 4 | France | 35.0% | 34.0% | 31.0% | 27.0M |
| 5 | Italy | 35.0% | 34.0% | 31.0% | 20.5M |
| 6 | Spain | 35.0% | 34.0% | 31.0% | 18.5M |
| 7 | Poland | 35.0% | 34.0% | 31.0% | 15.5M |
| 8 | Netherlands | 35.0% | 34.0% | 31.0% | 9.2M |
| 9 | Sweden | 35.0% | 34.0% | 31.0% | 5.0M |
| 10 | United States | 29.0% | 40.0% | 31.0% | 155.0M |
| 11 | Germany | 35.0% | 35.0% | 30.0% | 45.0M |
| 12 | Japan | 35.0% | 36.0% | 29.0% | 63.0M |
| 13 | South Korea | 36.0% | 35.0% | 29.0% | 25.5M |
| 14 | China | 50.0% | 28.0% | 22.0% | 760.0M |
| 15 | Mexico | 52.0% | 27.0% | 21.0% | 55.0M |
| 16 | Saudi Arabia | 52.0% | 27.0% | 21.0% | 11.0M |
| 17 | Malaysia | 52.0% | 27.0% | 21.0% | 14.0M |
| 18 | Brazil | 52.0% | 28.0% | 20.0% | 90.0M |
| 19 | Russia | 50.0% | 30.0% | 20.0% | 66.0M |
| 20 | Turkey | 52.0% | 28.0% | 20.0% | 30.0M |
| 21 | Thailand | 52.0% | 28.0% | 20.0% | 35.0M |
| 22 | Philippines | 58.0% | 24.0% | 18.0% | 42.0M |
| 23 | South Africa | 58.0% | 24.0% | 18.0% | 14.0M |
| 24 | Egypt | 60.0% | 24.0% | 16.0% | 27.0M |
| 25 | India | 62.0% | 23.0% | 15.0% | 500.0M |
| 26 | Indonesia | 62.0% | 23.0% | 15.0% | 125.0M |
| 27 | Vietnam | 62.0% | 23.0% | 15.0% | 47.0M |
| 28 | Nigeria | 64.0% | 22.0% | 14.0% | 50.0M |
| 29 | Pakistan | 64.0% | 22.0% | 14.0% | 50.0M |
| 30 | Bangladesh | 66.0% | 21.0% | 13.0% | 67.0M |
What Is JobZone Risk?
JobZone Risk is the world’s first comprehensive AI job displacement scoring system, rating 3,649 professions on a 0–100 scale across 8 dimensions. Every role is classified into a GREEN (AI-resistant), YELLOW (changing), or RED (high displacement risk) zone.
Built by Nathan House, CEO of cybersecurity training platform StationX, after realising AI would displace the very entry-level jobs his students were training for. The scoring methodology draws on 47 data sources including Oxford, McKinsey, OECD, BLS, and Anthropic research. Full methodology →
Convergent Evidence: Anthropic’s Data Confirms JobZone Scores
March 2026 — Massenkoff & McCrory, “Labor market impacts of AI”
Two completely independent approaches — one measuring actual AI usage from inside the model (Anthropic), one measuring labour market impact from 47 external data sources (JobZone) — arrived at the same conclusions about which jobs face the highest displacement risk.
Result: 10 out of 10 match. Every occupation Anthropic flagged as highly exposed falls in JobZone’s Red or Yellow Urgent zone.
| Occupation | Anthropic Exposure | JobZone Score | Zone |
|---|---|---|---|
| Computer Programmers | 74.5% | 10.2 | Red |
| Customer Service Reps | 70.1% | 13.2 | Red |
| Data Entry Keyers | 67.7% | 2.3 | Red |
| Medical Records Specialists | 66.7% | 15.1 | Red |
| Info Security Analysts | 49.8% | 22.9 | Red |
| Market Research Analysts | 64.0% | 26.0 | Yellow Urgent |
| Computer User Support | 46.3% | 26.3 | Yellow Urgent |
| Sales Reps (Wholesale/Mfg) | 42.8% | 26.1 | Yellow Urgent |
| Financial Analysts | 37.2% | 26.4 | Yellow Urgent |
| Software QA Analysts | 30.9% | 26.0 | Yellow Urgent |
Anthropic Exposure = percentage of tasks actually performed by AI in production (Claude usage data). JobZone Score = 0–100 composite risk score (lower = higher displacement risk). Sorted by Anthropic exposure descending.
What Anthropic’s data doesn’t cover: Anthropic provides one number per occupation across 756 roles. JobZone scores 3,649 roles across 8 dimensions, differentiates by seniority level (a junior developer and a staff architect face very different risks), includes automation barriers, and provides individual survival strategies. Anthropic measured what AI does. JobZone measures what happens to the people.
Key Findings
Attributed to Nathan House, CEO of StationX and creator of JobZone Risk. Click any quote to copy.
Ready-to-Publish Quotes
Top 10 Safest Roles
| # | Role | Score | Zone |
|---|---|---|---|
| 1 | Electrical Power-Line Installer and Repairer (Mid-Level) | 91.6 | GREEN |
| 2 | Signalling Tester In Charge / STIC (Mid-Level) | 87.7 | GREEN |
| 3 | Model Alignment Researcher (Mid-Level) | 86.1 | GREEN |
| 4 | AI Safety Researcher (Mid-Senior) | 85.2 | GREEN |
| 5 | Foster Carer (Mid-Level) | 84.5 | GREEN |
| 6 | Leadworker (Mid-Level) | 83.7 | GREEN |
| 7 | Heat Pump Installer (Mid-Level) | 83.5 | GREEN |
| 8 | Trauma Surgeon (Mid-to-Senior) | 83.2 | GREEN |
| 9 | CCS Engineer (Control Command & Signalling) (Mid-Level) | 83.2 | GREEN |
| 10 | Chief Information Security Officer (CISO) (Senior/Executive) | 83.0 | GREEN |
Top 10 Most At-Risk Roles
| # | Role | Score | Zone |
|---|---|---|---|
| 1 | File Clerks (Mid-Level) | 1.5 | RED |
| 2 | Micro-Task Worker (Online) (Mid-Level) | 1.7 | RED |
| 3 | Data Entry Keyer (Mid-Level) | 2.3 | RED |
| 4 | Word Processor and Typist (Mid-Level) | 2.6 | RED |
| 5 | Vulnerability Tester / Scanner Operator (Entry-Level) | 2.7 | RED |
| 6 | Telephone Operator (Mid-Level) | 3.0 | RED |
| 7 | Virtual Assistant (Entry-to-Mid Level) | 3.2 | RED |
| 8 | Live Chat Support Agent (Entry-to-Mid Level) | 3.4 | RED |
| 9 | Telemarketer (Mid-Level) | 3.4 | RED |
| 10 | Medical Transcriptionist (Mid-Level) | 3.6 | RED |
These are the extremes. Browse all 3,649 scored roles →
You’re in the data too.
A reporter scores RED. A foreign correspondent scores GREEN. Same profession, completely different AI future. Seniority and specialism change everything.
Generic reporting roles scored RED. Specialist and senior journalism roles scored GREEN. The pattern holds across the whole profession. See all journalism roles →
It’s Already Happening
These aren’t forecasts. Real companies are already cutting real jobs and citing AI as the reason. Every story below is independently sourced.
AI Layoffs Tracker 2026 — Companies Cutting Jobs Due to AI | DisplaceIndex
The DisplaceIndex AI Layoffs Tracker for 2026 highlights numerous companies reducing their workforce due to AI. Examp...
Oracle shed 21,000 roles over the past year amid wave of AI layoffs from tech giants - CNBC
Oracle sheds 21,000 roles over the past year amid wave of AI layoffs from tech giants. Oracle reduced its workforce b...
List of Companies Announcing AI-Driven Layoffs
Over 150,000 employees have been impacted by AI-driven layoffs in 2026, with over 50 CEOs citing AI efficiencies as a...
AI Is Now The Leading Reason Cited For Layoffs—Tech Has Lost 123,000 Jobs This Year
The technology industry has seen over 123,000 job cuts this year, with artificial intelligence becoming the most freq...
Survey reveals that 99% of CEOs now expect AI-driven layoffs — companies are racing to replace junior workers with AI, even as many executives remain uncertain about the returns on AI investments | Tom's Hardware
A recent Mercer study indicates that 99% of CEOs anticipate AI-driven layoffs in the short term, with an overwhelming...
Meta cuts 8,000 jobs and Microsoft offers first-ever buyouts as Big Tech converts payroll into AI capital expenditure
Meta and Microsoft announced significant workforce reductions on April 23, impacting up to 23,000 positions combined....
Anthropic CEO makes shocking admission about AI - TheStreet
Anthropic CEO Dario Amodei warns that AI could eliminate up to 50% of all entry-level white-collar jobs within one to...
78,557 Tech Workers Cut In Q1 2026 As AI Automation Accelerates | Smart Chunks
In Q1 2026, tech companies globally slashed 78,557 jobs, with 76.7% of these cuts occurring in the U.S. Nearly half (...
AI Also Creates Jobs — But Different Ones
Displacement is only half the story. AI adoption is simultaneously creating entirely new occupations that didn’t exist five years ago. The challenge: the people losing jobs aren’t the same people getting the new ones.
New Roles Hiring Now
JobZone has assessed 30 AI-created roles. These five have real job postings, real salaries, and measurable year-over-year growth based on our REL framework analysis.
Salaries range $95K–$300K+. Regulation (EU AI Act, NIST AI RMF) is a key driver of AI governance and safety hiring. Browse all assessed roles →
What the Forecasters Say
World Economic Forum (2025)
Projects 170 million new jobs created globally by 2030, against 92 million displaced — a net gain of 78 million. (Note: WEF’s 2023 report projected a net loss of 14 million. The revision reflects faster-than-expected AI-adjacent job creation.)
McKinsey Global Institute
Long-term net impact “likely positive” due to productivity gains, but up to 12 million U.S. workers may need to switch occupations by 2030. Massive reskilling required.
OECD Employment Outlook
Negative employment effects from AI have not yet materialised to a significant extent. 27% of OECD jobs at high risk. Outcome depends heavily on policy actions.
Indeed Hiring Lab (Jan 2026)
AI job postings growing 130%+ year-over-year, but in an otherwise weak “low-hire, low-fire” labour market. AI roles are bucking the trend.
Why this doesn’t solve the problem
Net job creation projections assume successful reskilling at scale. The new roles require significant technical skills, pay $100K+, and concentrate in metros with existing tech ecosystems. A displaced call centre worker in Ohio cannot become an AI Safety Researcher without years of retraining and likely relocation. The story: job creation numbers are meaningless without transition infrastructure.
Sources: WEF Future of Jobs 2025, McKinsey, OECD, Indeed Hiring Lab, PwC AI Jobs Barometer. AI-created role data from JobZone’s own REL framework assessment of 30 roles.
How Fast Is This Moving?
The question isn’t whether AI will reshape the labour market — it’s how quickly different sectors will be hit. Institutional forecasts and our own JobZone data converge on three overlapping phases.
Phase 1: Now
2024–2027
Already underway
Knowledge-work automation via LLMs. Entry-level white-collar displacement accelerating. First factory humanoid deployments.
Who’s affected:
RED-zone roles — data entry, bookkeeping, junior developers, admin assistants, SDRs.
Phase 2: Near-Term
2027–2032
Accelerating
Agentic AI handling multi-step workflows. Semi-structured robotics pilots in hospitals and new construction. Professional services disruption.
Who’s affected:
YELLOW-zone roles — analysts, mid-level tech, paralegals, some professional services.
Phase 3: Medium-Term
2032–2040+
Physical work enters
Robotics expands into unstructured environments — homes, existing buildings, bedside care. Task automation begins in trades and healthcare.
Who’s affected:
Currently GREEN roles with physical-world protection start eroding — but skilled trades and bedside care retain 20–35+ years of protection.
What the Data Shows
Entry-level employment in AI-exposed roles down ~13% since 2022 (up to 16% relative to less-exposed occupations). Entry-level software development job postings down nearly 20% from their late-2022 peak. The pipeline damage may be irreversible within 2–3 years without intervention.
300 million full-time jobs globally exposed to generative AI. Two-thirds of US occupations have some exposure, with 25–50% of workload potentially replaceable.
40% of global employment exposed to AI — rising to 60% in advanced economies. In low-income countries, 26%. Of exposed jobs in advanced economies, roughly half may benefit; the other half face reduced demand.
50% of work activities could be automated between 2030 and 2060, with a midpoint of ~2045. Generative AI accelerated this estimate by roughly a decade compared to McKinsey’s pre-2023 forecast.
PwC’s Three Waves: Algorithm wave (~3% of jobs, to early 2020s) → Augmentation wave (~20%, to late 2020s) → Autonomy wave (~30%, to mid-2030s). Each wave expands the blast radius from data tasks to physical-world tasks.
Both sides are accelerating
The gap between forecasts and reality is shrinking. WEF revised its 2023 projection (net −14 million jobs by 2027) to net +78 million by 2030 — not because displacement slowed, but because new-role creation is happening faster than expected. Displacement and creation are both accelerating. The story: the window for proactive intervention is narrower than it appears.
Sources: PwC Three Waves (2018), Goldman Sachs (2023), IMF (2024), McKinsey (2023), WEF Future of Jobs 2025.
Workers Affected by Country
US data from BLS; other countries estimated using IMF/OECD sector-weighted labour models.
| Country | Workforce | At Risk | Changing | Safe |
|---|---|---|---|---|
| 🇺🇸US | 168.7M | 44.3M | 68.1M | 56.2M |
| 🇬🇧UK | 34.2M | 10.6M | 11.6M | 12.0M |
| 🇪🇺Europe | 209.0M | 58.5M | 73.2M | 77.3M |
| 🇩🇪Germany | 46.0M | 12.9M | 16.1M | 17.0M |
| 🇯🇵Japan | 69.0M | 17.3M | 24.8M | 26.9M |
| 🇨🇦Canada | 20.7M | 6.6M | 6.8M | 7.2M |
| 🇦🇺Australia | 14.6M | 4.5M | 4.8M | 5.3M |
| 🇰🇷South Korea | 29.5M | 8.0M | 10.3M | 11.2M |
| 🌍Global | 3.5B | 724.5M | 1.3B | 1.4B |
AI Resistance by Industry Domain
Average JobZone Risk Score per domain. Higher = more AI-resistant. Scores below 25 = RED zone, 25–47 = YELLOW, 48+ = GREEN.
Fact Sheet
| Product | JobZone Risk |
| URL | jobzonerisk.com |
| What it does | Scores jobs for AI displacement risk (0–100) |
| Roles scored | 3,649 |
| Industry domains | 28 |
| US workforce covered | 100% (168.7M workers) |
| Data sources | 47 (Oxford, McKinsey, OECD, BLS, Anthropic) |
| Methodology | AIJRI v3.2 |
| Updates | Continuous (news-fed, real-time) |
| Founded by | Nathan House, CEO of StationX |
| Price | Free |
| API access | Free API key available |
Access the Data
All JobZone Risk data is free. Search roles, explore dashboards, or plug the full dataset directly into your own analysis.
Media Assets
High-resolution assets for editorial use. Click to download.
Workers at Risk by Country
Data visualisations ready for editorial use. Available in dark and light versions.
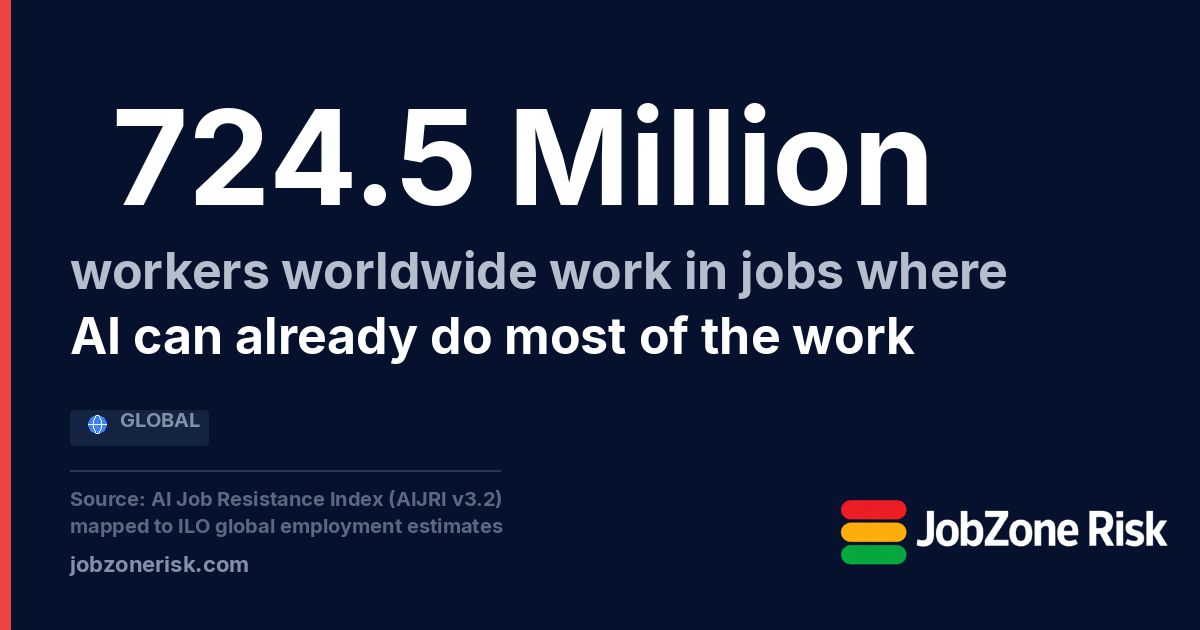
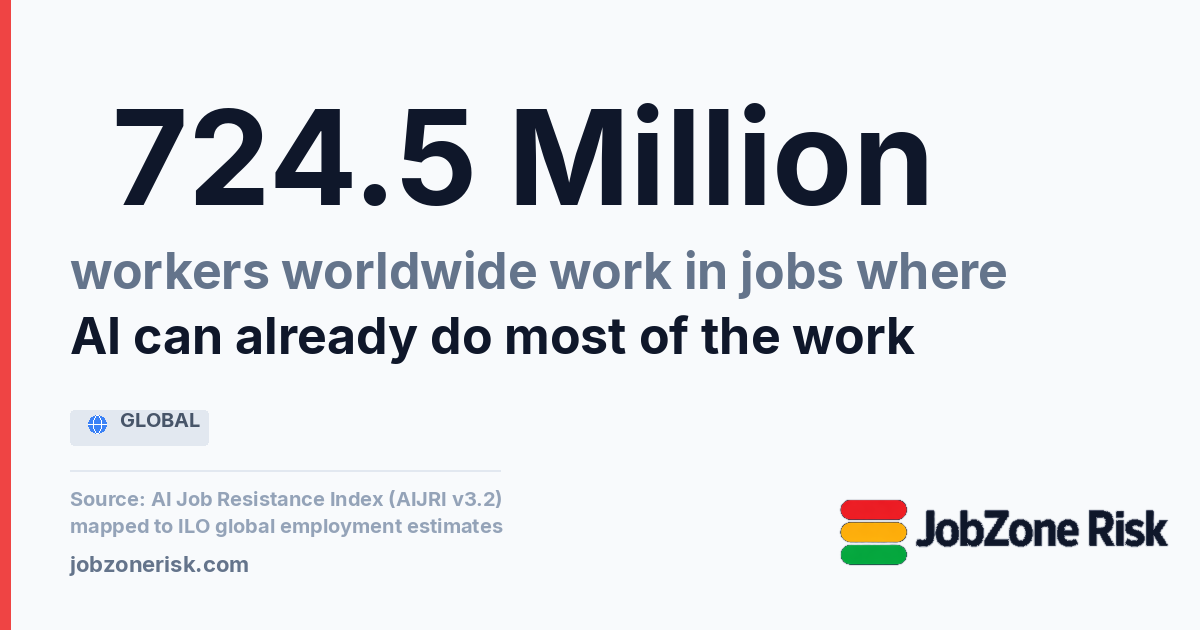
All graphics based on JobZone scores mapped to national employment data. Jobs scoring under 25/100 are ones where AI can already perform most core tasks.
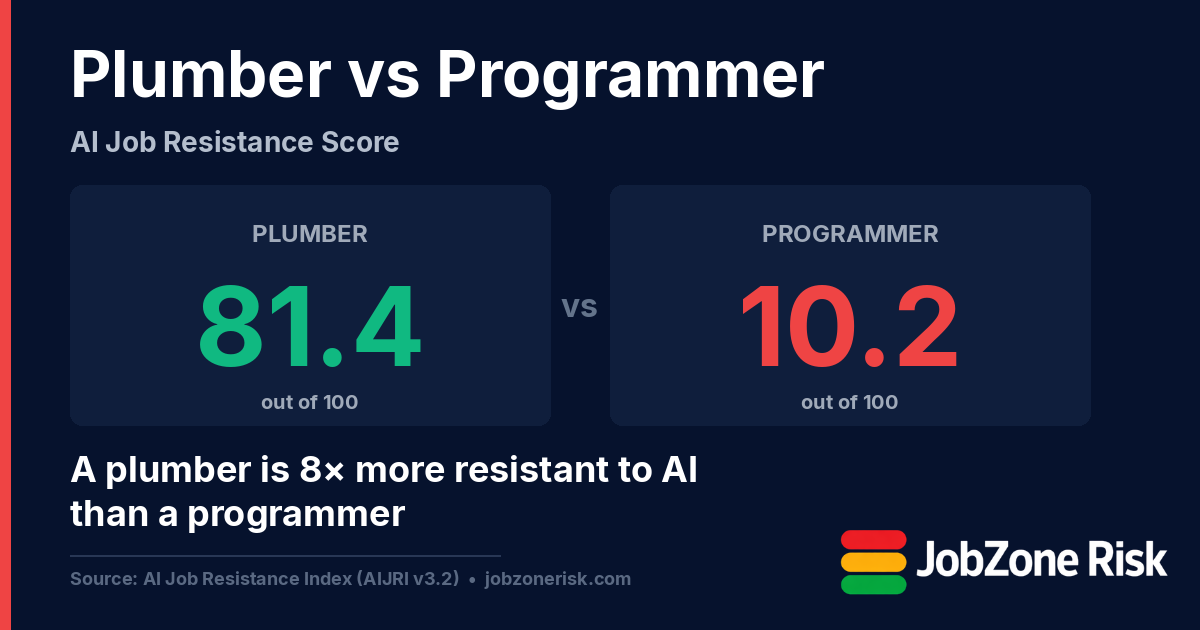
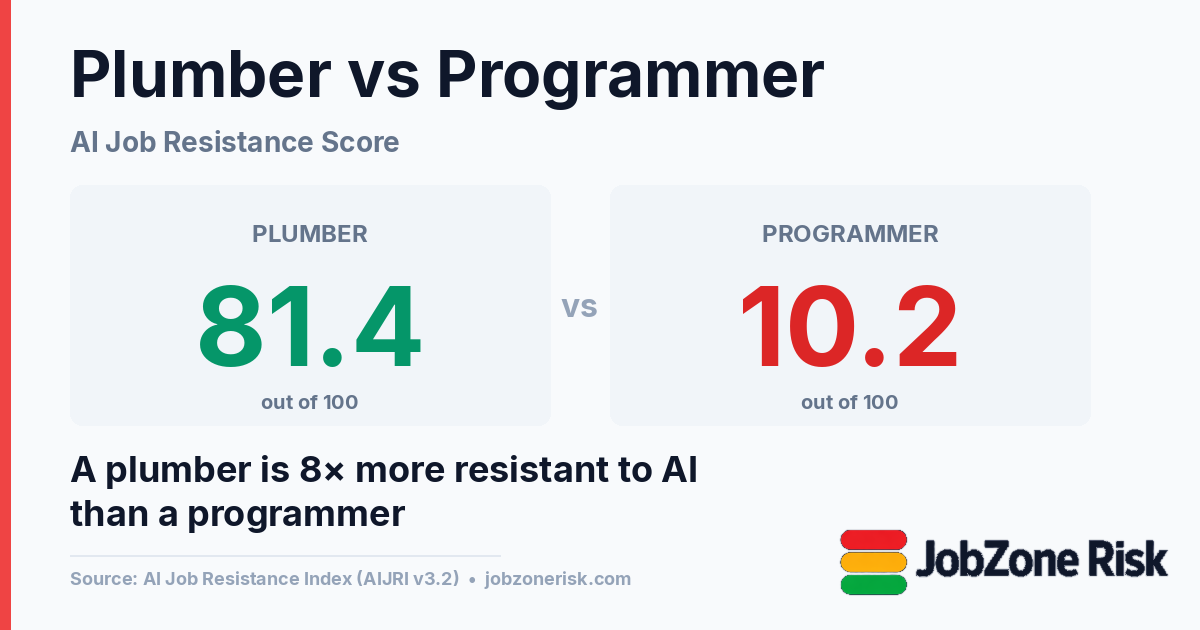
Plumber vs Programmer
A plumber scores 8× higher on AI resistance than a programmer. Our most contrarian finding.
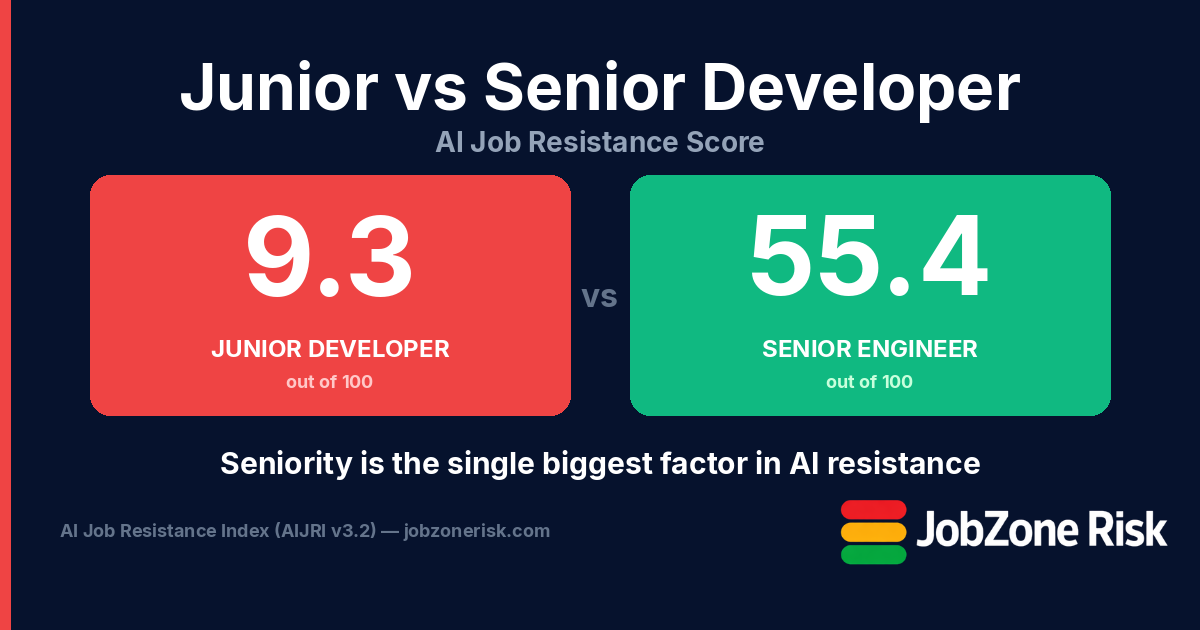
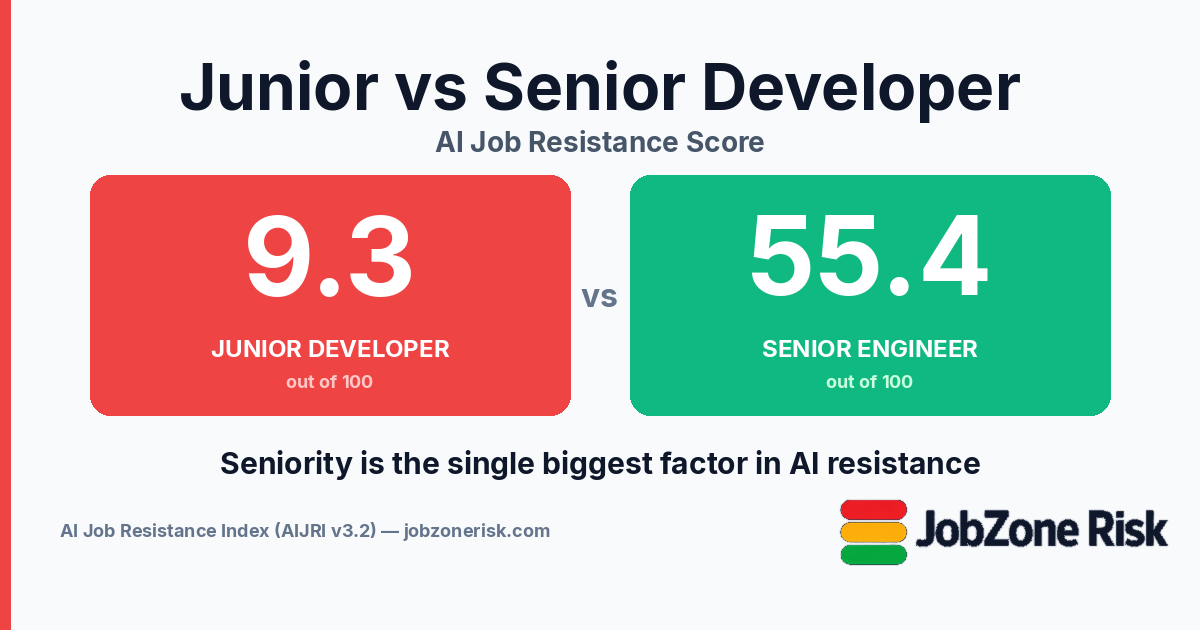
Junior vs Senior Developer
Seniority is the single biggest factor in AI resistance. A junior developer scores 9.3; a senior engineer scores 55.4.
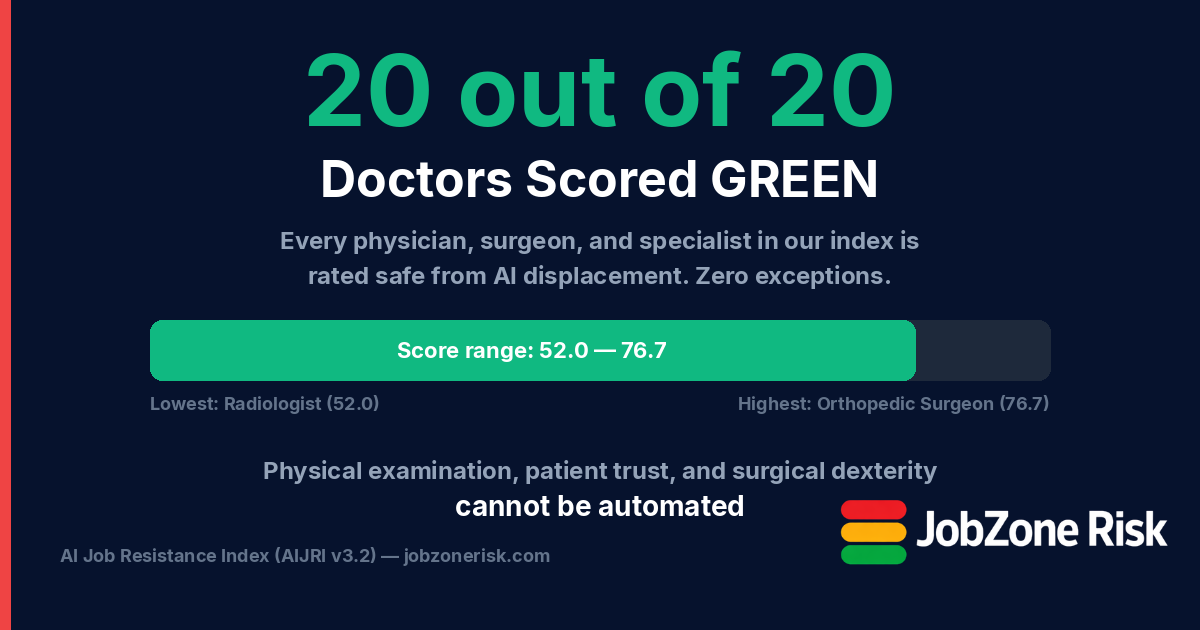
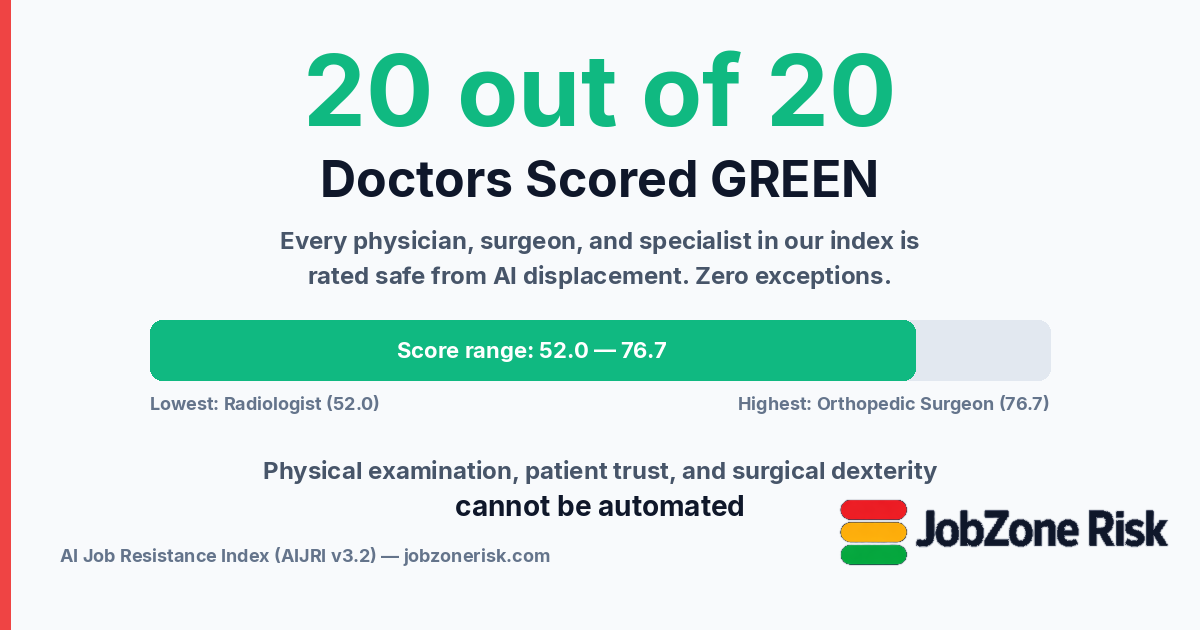
Every Doctor is GREEN
All 20 physician and surgeon roles in our index scored GREEN. Scores range from 52.0 (Radiologist) to 76.7 (Orthopedic Surgeon).
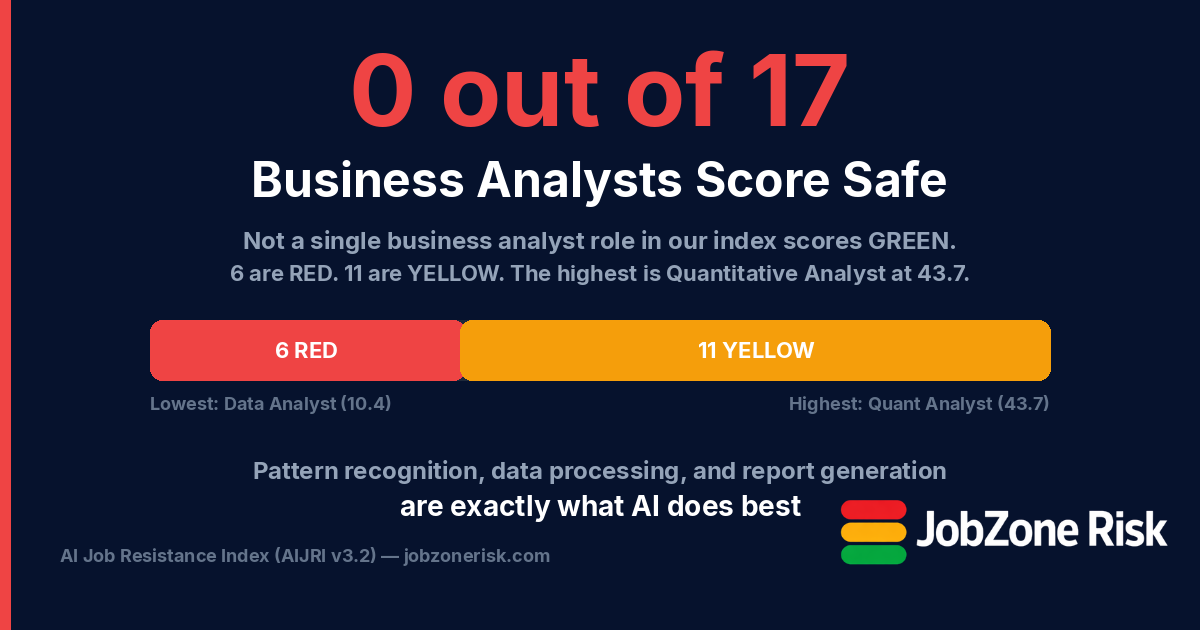
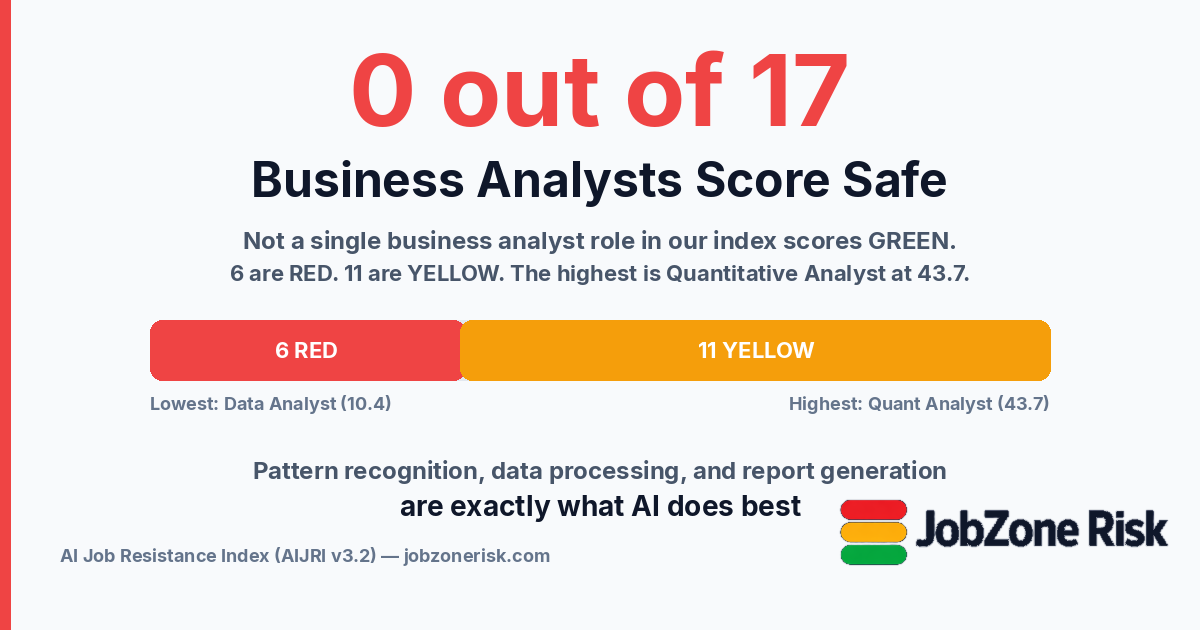
Zero Analysts Score Safe
0 out of 17 business analyst roles scored GREEN. Six are RED. The highest (Quantitative Analyst) manages only 43.7.
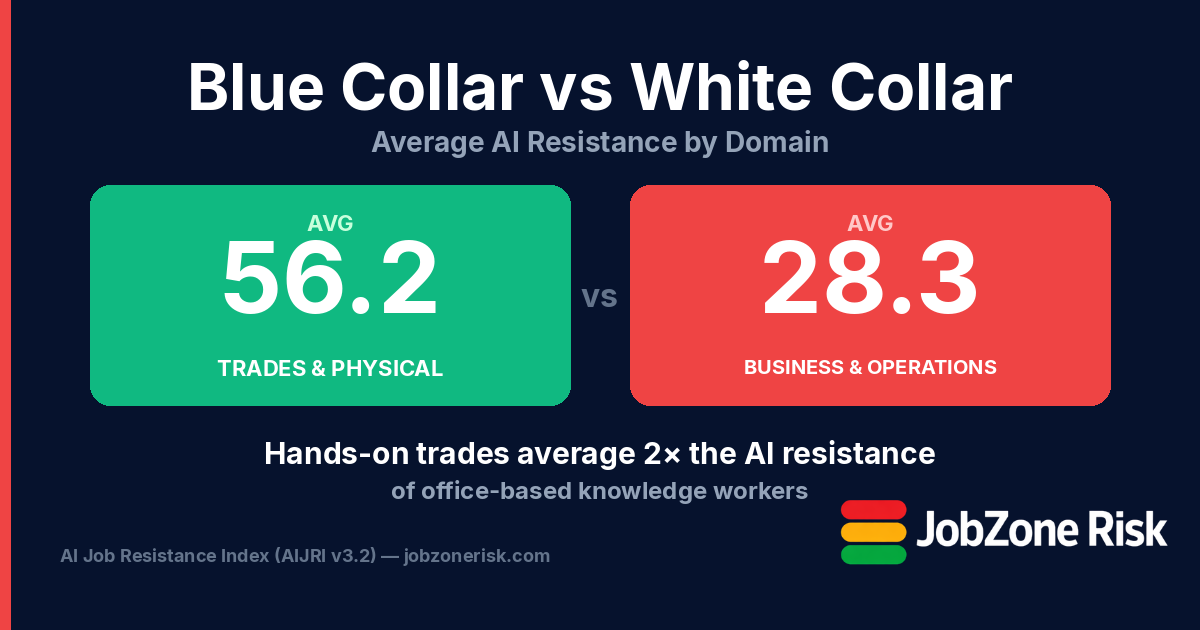
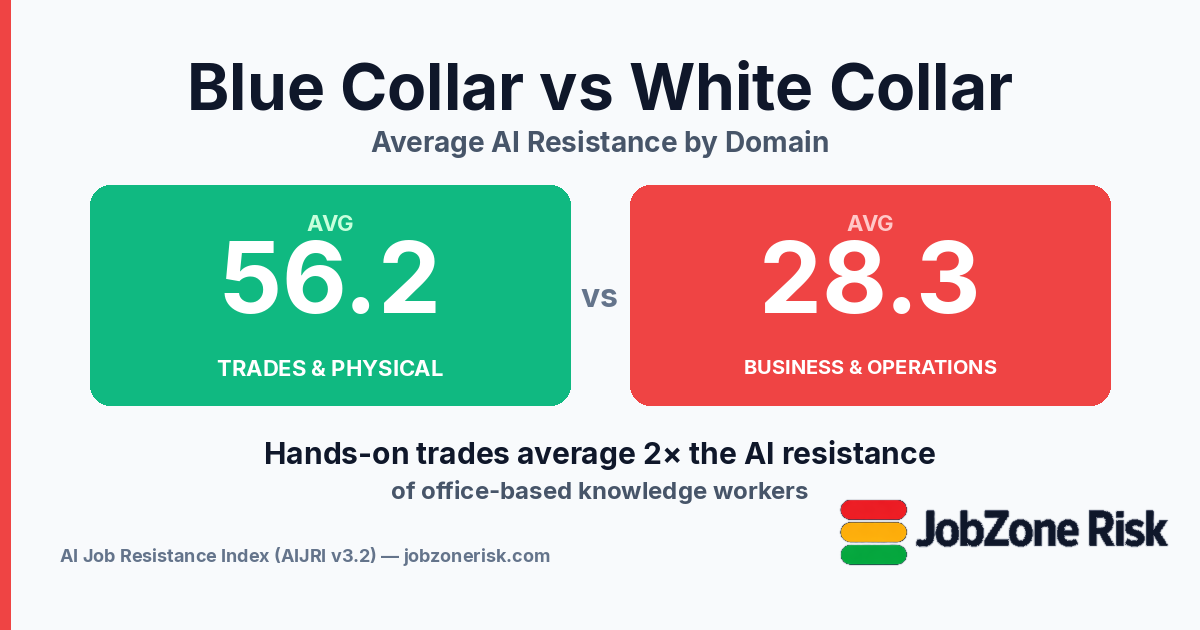
Blue Collar vs White Collar
Trades & Physical roles average 56.2 (GREEN). Business & Operations averages 28.3 (YELLOW). Hands-on work resists AI 2× better.
Brand Assets


About Nathan House

Nathan House is a cybersecurity and AI expert with 30 years of hands-on experience. He has secured systems at companies including Vodafone, BP, ExxonMobil, and GSK, and trained organisations including Microsoft, Cisco, Siemens, and Thales. He built JobZone Risk after realising AI would displace the very entry-level cybersecurity jobs his 500,000+ students were training for — and that no rigorous, data-driven index existed to quantify the risk. He is founder of StationX, one of the world’s largest cybersecurity training platforms. Why I built this →
- CNN, Fox News, NBC, NDTV
- PC Extreme Magazine
- Published white papers on AI, cybersecurity trends, and emerging threats
CISSP, OSCP, CEH, CISM, CISA, ISO 27001 Lead Auditor, SABSA
Press Contact
Nathan House is available for interviews, commentary, and data requests. For press enquiries:
Typical response time: same business day.
Methodology
Every role is scored using an 8-dimension framework — the AI Job Resistance Index (AIJRI) — that measures current AI capability overlap, automation barriers, displacement evidence, protective factors, market dynamics, and growth correlation. Each dimension produces a sub-score; the weighted composite becomes the role’s overall JobZone Score (0–100).
Based on 47 data sources including Oxford, McKinsey, OECD, and BLS. Scores are re-evaluated as AI capabilities and labour market data change.
Scores aren’t static. JobZone Risk continuously monitors global news feeds, tracking AI capability announcements, labour market shifts, and regulatory changes. Each story is assessed for sentiment and relevance — when a material event occurs (new legislation, a major AI deployment, an industry restructuring), affected role scores are re-evaluated and updated. This means the data journalists cite today reflects the current state of AI displacement, not a one-time snapshot.